- Numbers
- What does the number stand for?
- Nearest number
- Which digit is in the place?
- Round off to the nearest number
- Number divide
- Find the fraction nearest to 1
- Sort fraction numbers
- Find the largest or smallest fraction
- Fraction to decimal
- Convert decimal to a mixed fraction.
- Fraction - Addition
- Fraction - Substraction
- Fraction - Multiply
- Fraction - Divide
- List all the common factors of two integers
- Chicken and Rabbit problem
- Assumption Method
- Measurement
- Data Analysis
- Geometry
- Speed
- Others
- P5 Maths
- P4 Maths
- Tap to switch levels
- Numbers
- Measurement
- Data Analysis
- Geometry
- Speed
- Others
- P5 Maths
- P4 Maths
SELECT A SUBJECT
- Numbers
Question 1 of 86
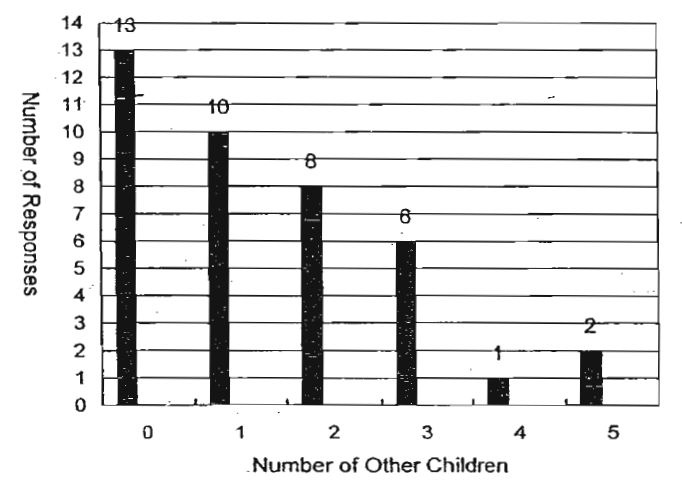
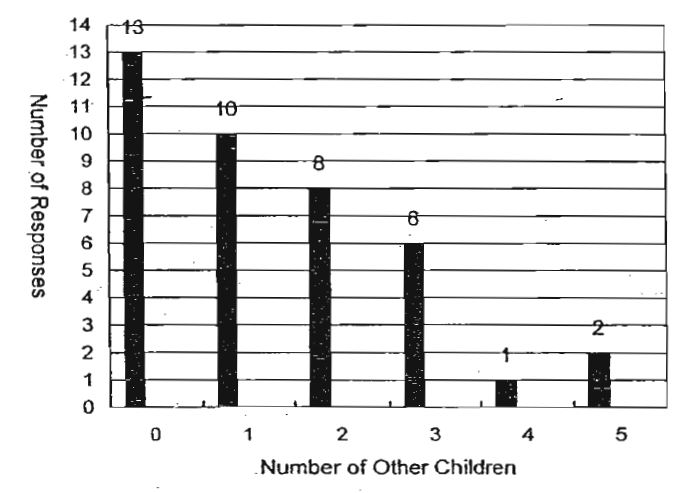
A child from every unit in a block of flats was asked how many other children lived in the same flat. The bar graph below presents the results. Study it carefully and answer Question
From the survey, what is the largest number of children living in a flat?
Sorry. Please check the correct answer below.
You are Right
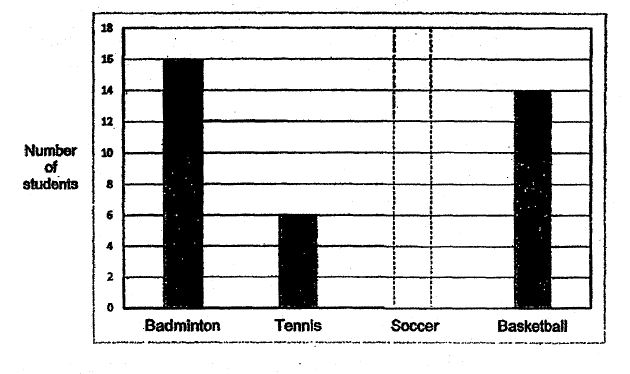
The bar graph shows the number of students playing in the various sports during the school`s games day. of the student play soccer. Draw the bar that shows the number of students who play soccer.
Sorry. Please check the correct answer below.
You are Right
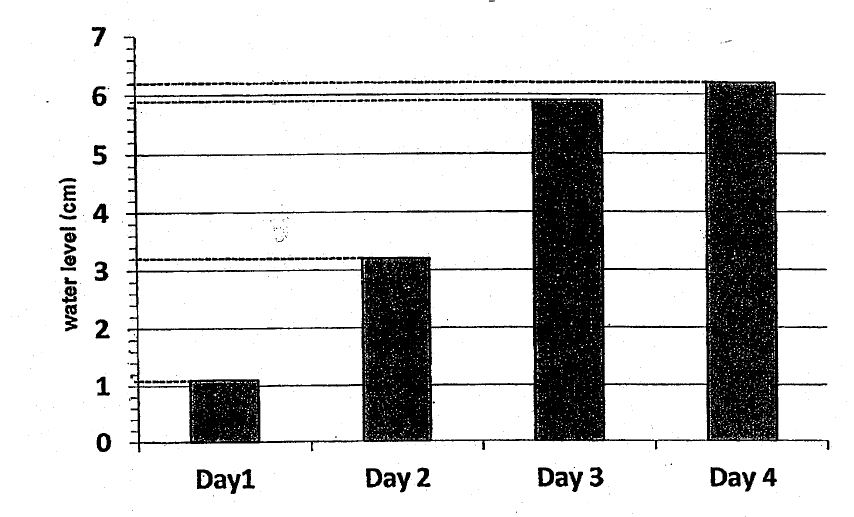
Mr Chee wanted to measure the amount of rainfall during a rainy season. He placed an empty beaker and observed the water level of the beaker and the results are shown in the graph below.
(a) What is the increase in water level from Day 1 to Day 2?
(b) Find the average water level in the beaker over 4 days.
(b) 4.1 cm
(b) 4.1 cm
(b) 3.1 cm
(b) 5.1 cm
Sorry. Please check the correct answer below.
(b) 4.1 cm
You are Right
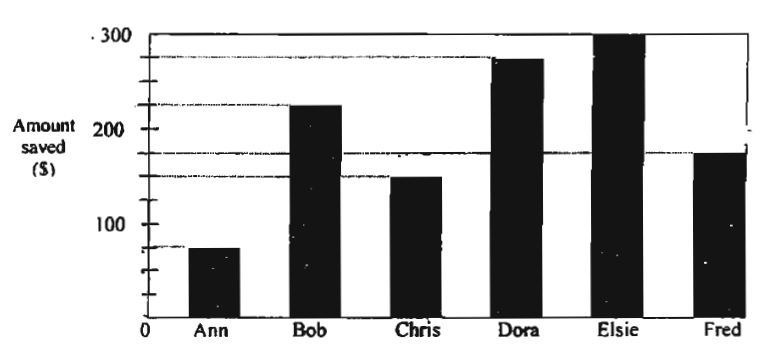
The line graph shows the savings of 6 pupils in August. Each pupil had $500 at first. Study the graph carefully and answer the questions that follow.
(a) What was the total amount of money saved by the children?
(b)What fraction of the total amount of money was spent?
(Give your answer in its lowest terms)
(b) 2/5
(b) 3/5
(b) 4/5
(b) 5/5
Sorry. Please check the correct answer below.
(b) 3/5
You are Right
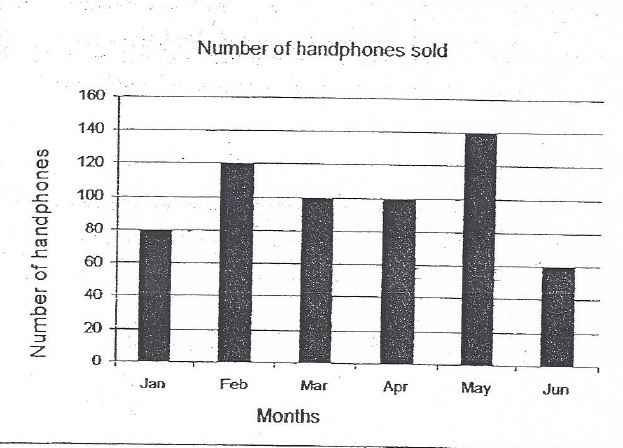
The bar graph below shows the number of handphones sold over a 6 month period in a shop.
In which month did the shop sell 20% of the total number of handphones?
Sorry. Please check the correct answer below.
You are Right
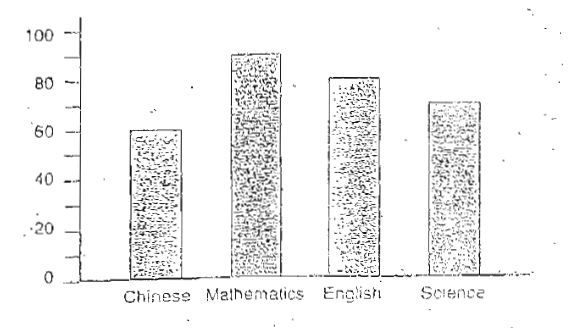
The bar chart below shows the marks scored by a student in an examination. Study it carefully and answer the questions that follow.
(a) What was his average score for his best 3 subjects?
(b) What percentage of his total score was the English score?
Sorry. Please check the correct answer below.
You are Right
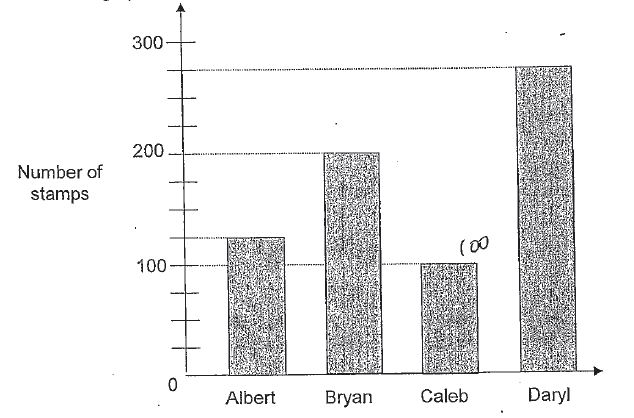
The graph below shows the number of stamps collected by 4 boys.
(a) What is the average number of stamps collected by each boy?
(b) How many stamps must Daryl give Albert so that both boys will get the same number of stamps?
(b) 45 stamps
(b) 55 stamps
(b) 65 stamps
(b) 75 stamps
Sorry. Please check the correct answer below.
(b) 75 stamps
You are Right
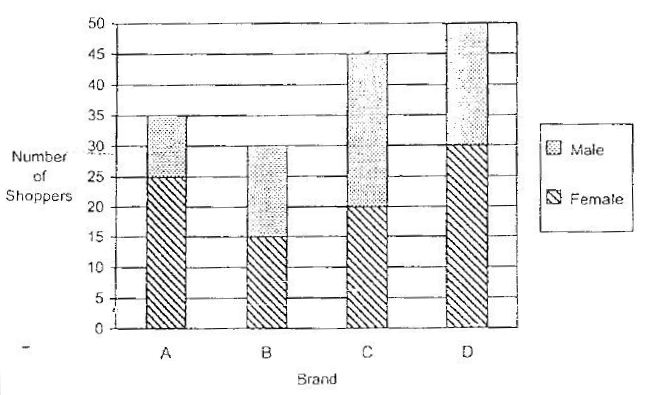
Some shoppers in a supermarket were asked to sample four different brands of chocolates A, B, C and D and select their favourite brand of chocolate. The results are shown in the bar graph below.
(a) What was the total number of shoppers who sampled the different brands of chocolate?
(b) What fraction of the male shoppers selected Brand C as their favourite brand of chocolate?
(b) $\frac{3}{14}$
(b) $\frac{5}{19}$
(b) $\frac{4}{14}$
(b) $\frac{5}{14}$
Sorry. Please check the correct answer below.
(b) $\frac{5}{14}$
You are Right
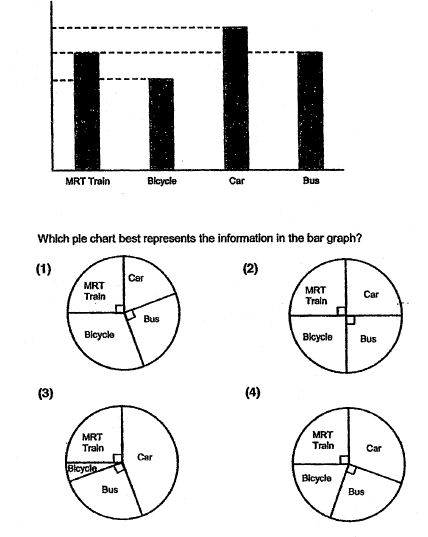
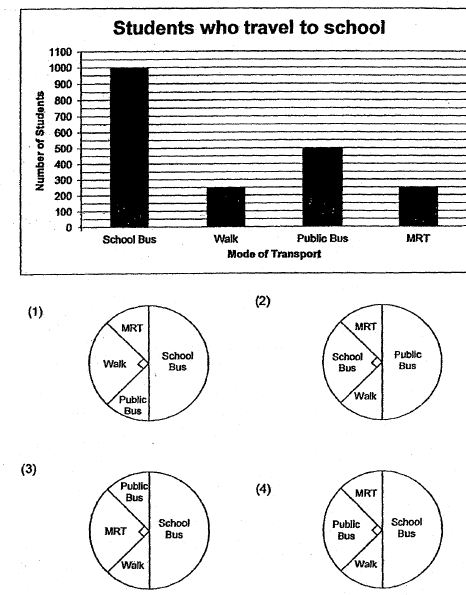
The bar graph shows the number of students who took different types of transport to school.
Which pie chart best represents the information in the bar graph?
Sorry. Please check the correct answer below.
You are Right
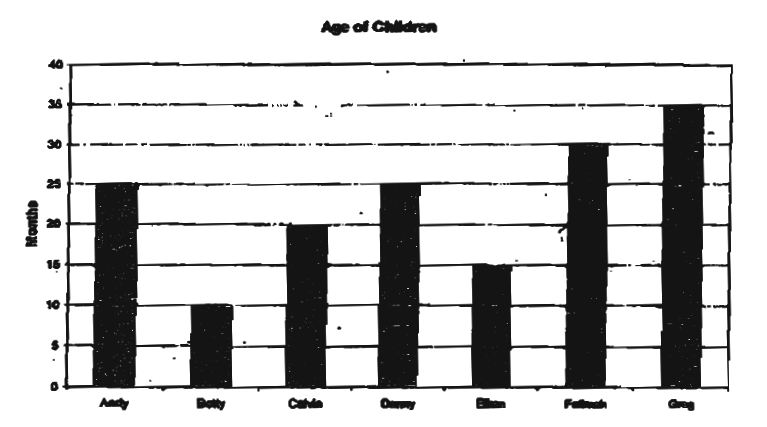
The bar chart above shows the age of 7 children in months
(a) What is the age of the oldest child in years and months?
(b) What is the age difference in years between Danny and the youngest child?
(c) In another 3 year 10 month, what will be Calvin`s age in years?
(b) 1 1/4 months
(c) 1.5 years
(b) 1 3/4 months
(c) 4.5 years
(b) 1 2/4 months
(c) 3.5 years
(b) 1 1/4 months
(c) 5.5 years
Sorry. Please check the correct answer below.
(b) 1 1/4 months
(c) 5.5 years
You are Right
A child from every unit in a block of flats was asked how many other children lived in the same flat. The bar graph below presents the results. Study it carefully and answer Question
What is the total number of children living in that block of flats?
Sorry. Please check the correct answer below.
You are Right
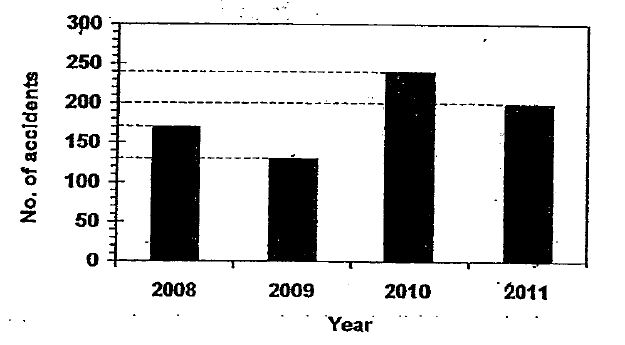
The bar graph below shows the number of car accidents in a country from 2008 to 2011.
In which year was there $\frac{5}{6}$ as many car accidents as in 2010?
Sorry. Please check the correct answer below.
You are Right
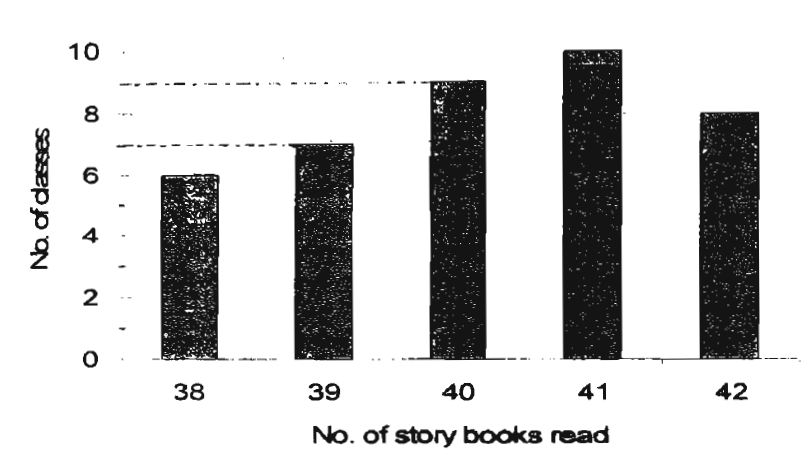
The graph below shows the number of story books read by the various classes in a school over a period of time.
(a) What was the total number of classes in the school?
(b) How many classes in the school read more than 40 story books?
(c) What percentage of the class in the school read fewer than 40 story books?
(b) 18 classes
(c) 31.5%
(b) 17 classes
(c) 33.5%
(b) 18 classes
(c) 32.5%
(b) 12 classes
(c) 37.5%
Sorry. Please check the correct answer below.
(b) 18 classes
(c) 32.5%
You are Right
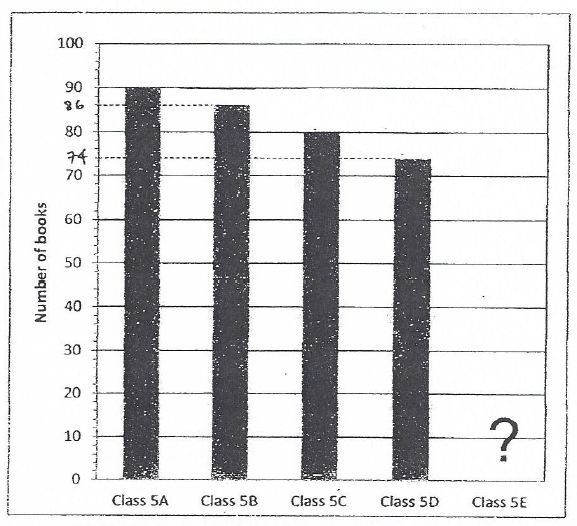
The graph shows the number of books borrowed from the library by 5 classes in a week. The average number of books borrowed by the 5 classes was 80. How many books did class 5E borrow from the library?
Sorry. Please check the correct answer below.
You are Right
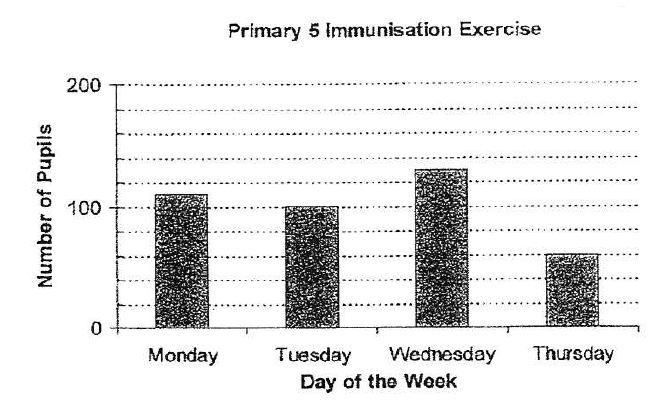
A school conducted an immunisation exercise for its primary 5 pupils from Monday to Thursday. Each of them had their immunisation on one of the four days.
The bar graph below shoes the number of pupils that had immunisation from Monday to Thursday
(a) What percentage of the pupils had their immunisation on Wednesday?
(b) Express the number of pupils who had their immunisation on Thursday as a fraction of those who had theirs on Tuesday. Leave you answer in its simplest form
(b) 3/5
(b) 5/5
(b) 4/5
(b) 3/5
Sorry. Please check the correct answer below.
(b) 3/5
You are Right
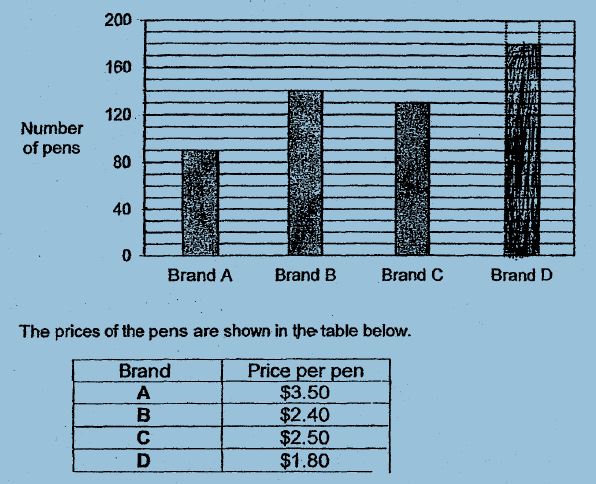
The bar graph shows the number of each brand of pen sold in a shop.
The prices of the pens are shown in the table below.
(a) How may brand B pens were sold?
(b) There were twice as many Brand D pens as Brand A pens sold. Draw the bar to show the number of Brand D pens sold.
(c) Each statement below is either true, false or not possible to tell from the graph. For each statement, put a tick mark in the correct column OR option in A B C D E.
(ci) The greatest amount of money is collected from the sale of Brand B pens. choose a option True OR False OR not possible to tell
(cii) The shop makes the most amount of money from the sale of Brand D pens. choose a option True OR False OR not possible to tell
(b) 160 as shown
(ci) True
(cii) not possible to tell
(b) 170 as shown
(ci) True
(cii) not possible to tell
(b) 180 as shown
(ci) True
(cii) not possible to tell
(b) 190 as shown
(ci) True
(cii) not possible to tell
Sorry. Please check the correct answer below.
(b) 180 as shown
(ci) True
(cii) not possible to tell
You are Right
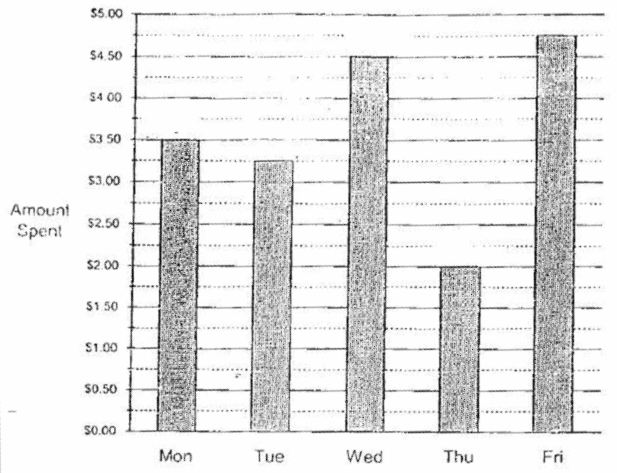
The graph shows the amount of money Jing Hua spent over five days.
Jing Hua had $20 at first. How much money did he have at the end of Wednesday?
Sorry. Please check the correct answer below.
You are Right
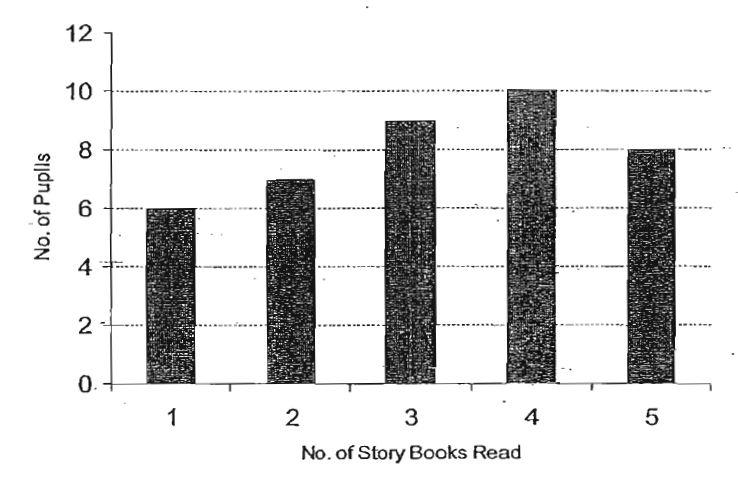
The graph below shows the number of story books read by the pupils in a class.
(a) What was the total number of pupils in the class?
(b) What fraction of the pupils in the class read more than 3 story books?
(c) What is the total number of story books read?
(b) $\frac{6}{20}$
(c) 227
(b) $\frac{7}{20}$
(c) 27
(b) $\frac{8}{20}$
(c) 12
(b) $\frac{9}{20}$
(c) 127
Sorry. Please check the correct answer below.
(a) 40
(b) 10+8=18
$\frac{18}{40}$=$\frac{9}{20}$
The fraction is $\frac{9}{20}$
(1x6)+(2x7)+(3x9)+(4x10)+(5x8)
=6+14+27+40+40
=127
(b) $\frac{9}{20}$
(c) 127
You are Right
(a) 40
(b) 10+8=18
$\frac{18}{40}$=$\frac{9}{20}$
The fraction is $\frac{9}{20}$
(1x6)+(2x7)+(3x9)+(4x10)+(5x8)
=6+14+27+40+40
=127
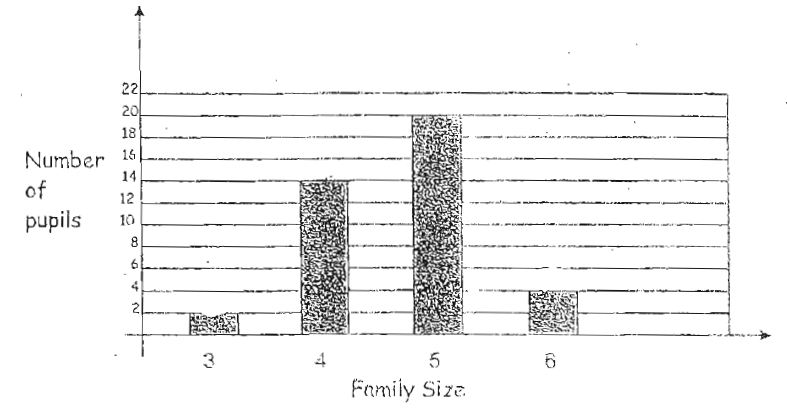
The graph below shows the family size of the pupils in a class, Study the graph carefully and answer.
The number of pupils with a family size of 4 is (how) (many) times those with a family size of 3.

Sorry. Please check the correct answer below.
You are Right
The table shows the number of students who travels to school using different modes of transport during schools days. Which pie chart represents the date correctly?
Sorry. Please check the correct answer below.
You are Right
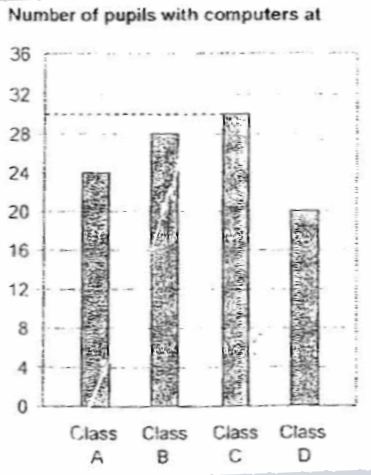
The bar graph below shows the number of pupils in four different classes with computers at home. Study the graph and answer the question below.
If there are 30 pupils in each class, what percentage of the total number of pupils have computer at home?
Sorry. Please check the correct answer below.
You are Right
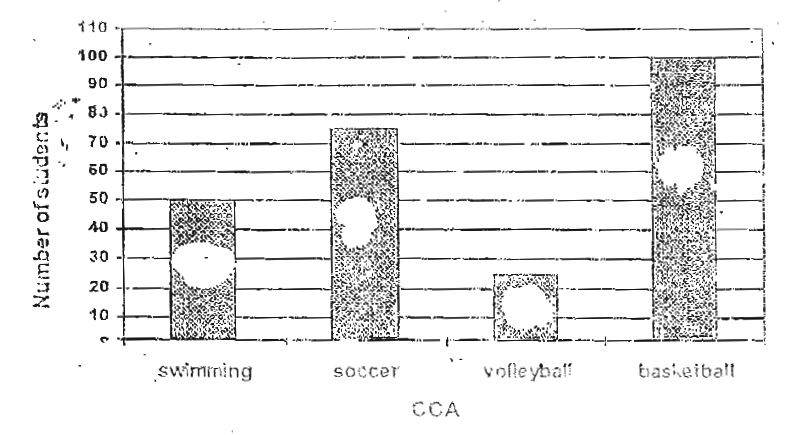
The graph below shows the favourite sports of the students in the yellow house. Study it and answer the following question.
What percentage of the students in Yellow House like swimming?
Sorry. Please check the correct answer below.
You are Right
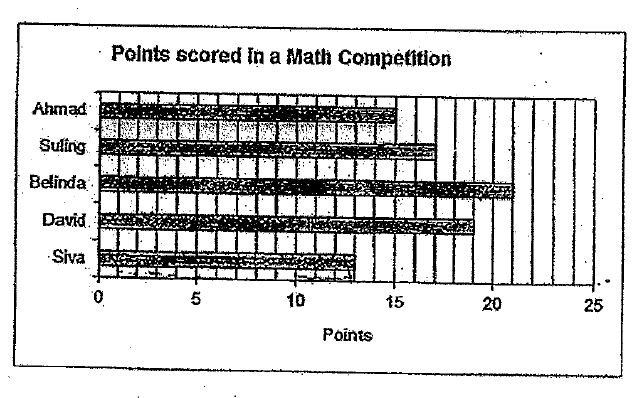
The graph below shows the points scored by pupils who participated in a Math competition. 2 points were awarded for each correct answer and 1 point was awarded for a partially correct answer. What is the maximum number of questions answered correctly by Suling?
Sorry. Please check the correct answer below.
You are Right
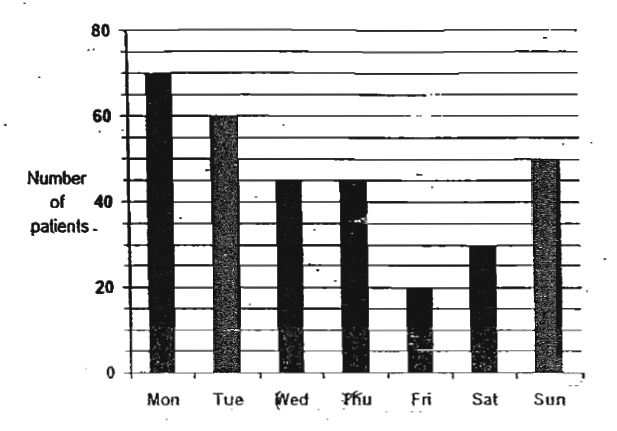
The graph below shows the number of patients who visited a clinic during a certain week.
(a) Find the total number of patients who visited the clinic on Wednesday and Thursday.
(b) There were 40% fewer patients on Saturday than on ----------
(b) Monday
Friday
Sunday
Sunday
Sorry. Please check the correct answer below.
Sunday
You are Right
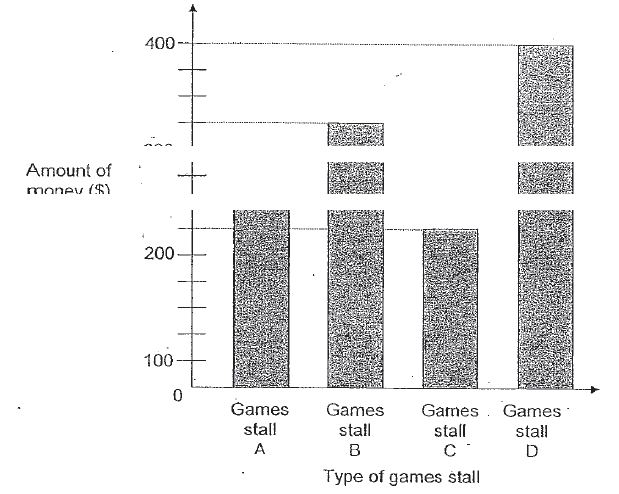
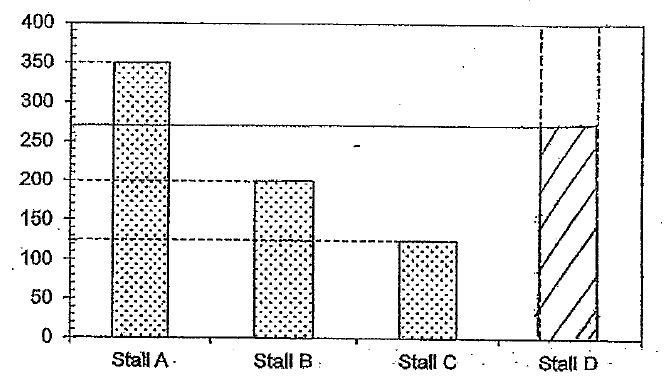
The graph below shows the amount of money collected from 4 games stalls at a carnival.
(a)What is the average amount of money collected from each games stall?
(b) If Games stall C wants its collection to be 20% more than games stall B, how much more money must it earn?
(b) 465
(b) 265
(b) 165
(b) 365
Sorry. Please check the correct answer below.
(b) 165
You are Right
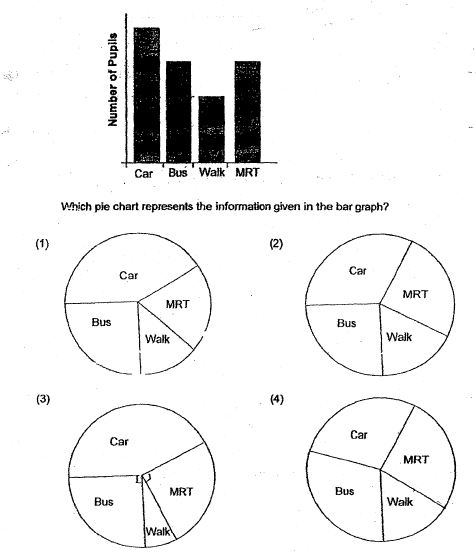
The bar graph shows how pupils of Champion primary School went to school on a certain day.
Which pie chart represents the information given in the bar graph?
Sorry. Please check the correct answer below.
You are Right
The graph below shoes the number of apples sold in Stall A, Stall B and Stall C. Study the graph below carefully.
(a) What is the average number of apples sold in Stall A, Stall B and Stall C?
(b) How many percent more apples did Stall A sell than Stall B?
(c) The number of apples sold in Stall D was $\frac{2}{5}$ of the total number of apples sold in Stall A, Stall B and Stall C. Draw the bar representing the number of apples sold in Stall D in the bar graph above. 1
b 75%
b 85%
b 75%
b 65%
Sorry. Please check the correct answer below.
b 75%
You are Right
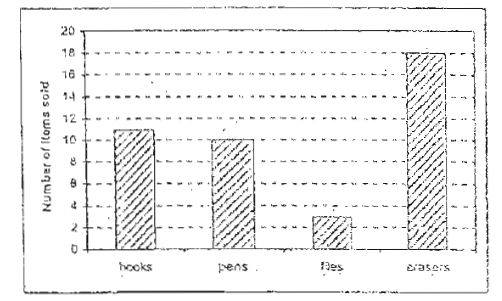
The following bar graph shows the number of items sold in a day. Each book cost 1 dollar, each pen cost 80 cents, each file cost 2 dollars and each eraser cost 50 cents. which of the 4 items has the highest total sale price?
Sorry. Please check the correct answer below.
You are Right
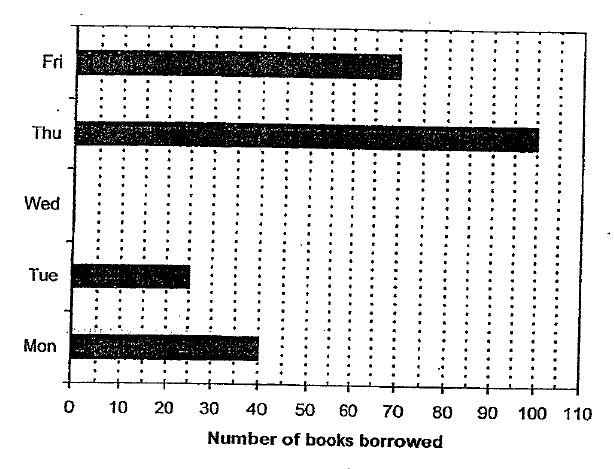
The graph below shows the number of books the pupils borrowed from a school library in five days. The bar that shows the number of books borrowed on Wednesday has not been drawn.
a The average number of books borrowed each day from Monday to Friday was 64. Find the total number of books borrowed on Wednesday.
b What was the percentage decrease in the number of books borrowed from Monday to Tuesday?
b 37.5%
b 47.5%
b 37.5%
b 37.5%
Sorry. Please check the correct answer below.
b 37.5%
You are Right
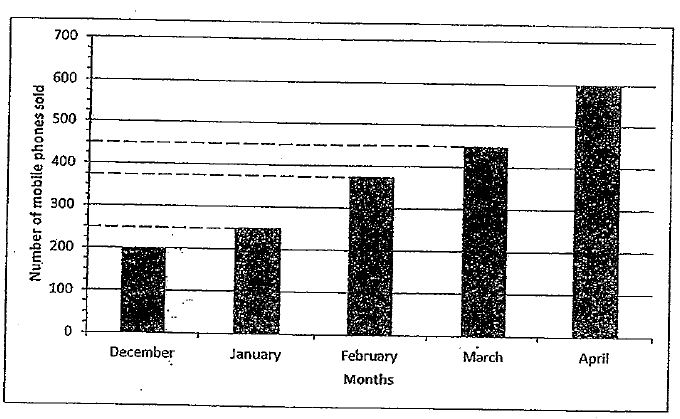
The bar graph below shows the number of mobile phones sold over a period of 4-5 months. Between which two months was there a 50% increase in the sales?
Sorry. Please check the correct answer below.
You are Right
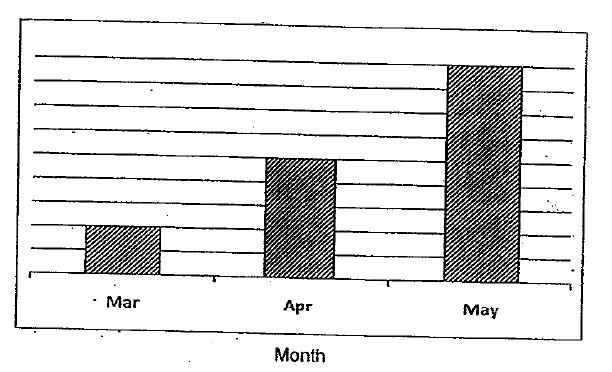
The bar chart shows the number of toys sold by Mr Tan for each month over a 3-month period. A part of the bar chart was torn. The difference in the number of toys sold in March and May was 56. How many toys were sold in April?
Sorry. Please check the correct answer below.
You are Right
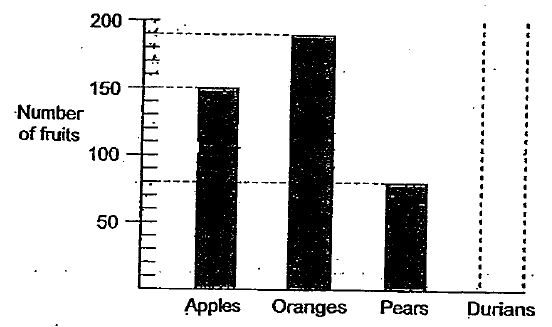
At a fruit stall, there are 4 types of fruits: apples, oranges, pears and durians. The bar graph below shows the number of each type of fruits at the stall. The bar that shows the number of durians has not been drawn. If 20% of the fruits at the stall are durians, how many durians are there?
Sorry. Please check the correct answer below.
You are Right
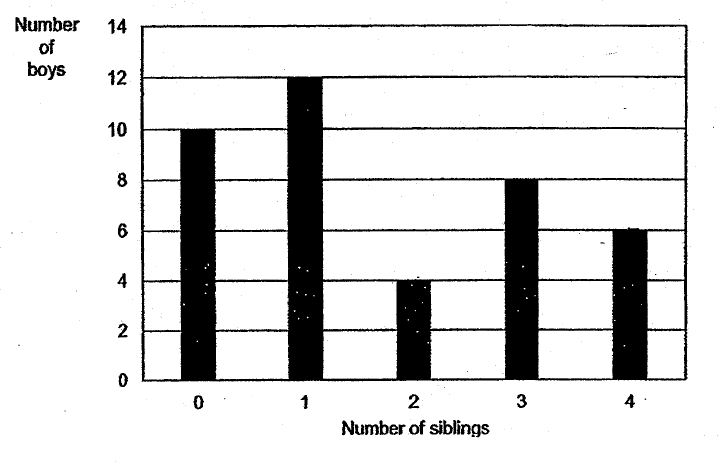
A survey was conducted on a group of 40 boys to find out the number of siblings they have. The results of the survey are showing in the bar graph below.
Based on the results, how many boys have the greatest number of siblings?
Sorry. Please check the correct answer below.
You are Right
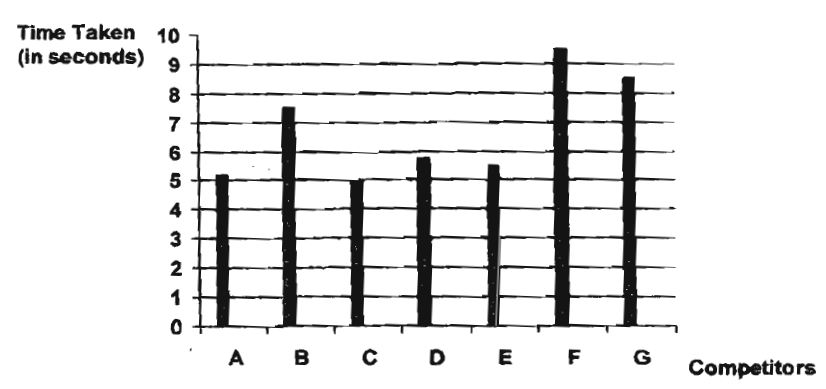
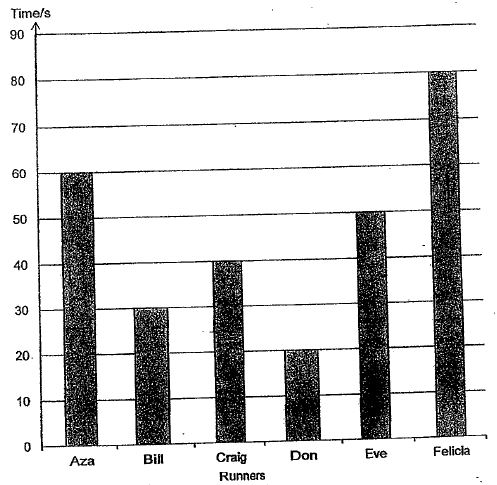
The graph below shows the time taken by 7 girls to complete the 100 m race. The table below shows the names of the winners in the same event. Study them carefully and answer.
Result of 100m race
First-- Helen
Second-- Ivy
Third-- Joey
Forth--Kelly
Which letter on the graph shows the time taken by joey?
Sorry. Please check the correct answer below.
You are Right
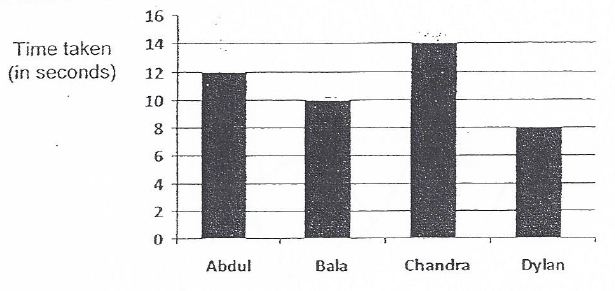
The bar graph below shows the time taken by 4 boys to complete a race.
Which boy finished third in the race?
Sorry. Please check the correct answer below.
You are Right
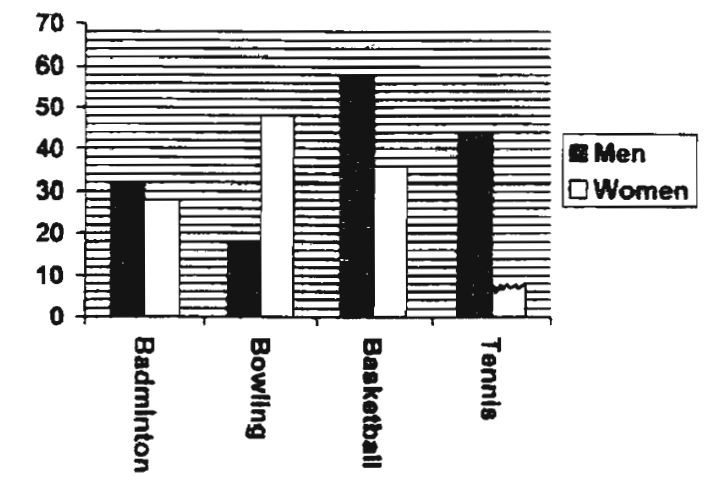
The graph below shows the number of participants in 4 different sports.
Study the graph carefully before you answer the question.
(a) What fraction of the participants in Badminton were men?
(b) What percentage of the total number of participants in Bowling and Basketball were women?
(c) If the average number of participants in all four sports was 78, how many women had participated in Tennis?
(b) 52$\frac{1}{1}$%
(c) 47
(b) 52$\frac{1}{2}$%
(c) 48
(b) 52$\frac{1}{3}$%
(c) 49
(b) 52$\frac{1}{4}$%
(c) 50
Sorry. Please check the correct answer below.
(b) 52$\frac{1}{2}$%
(c) 48
You are Right
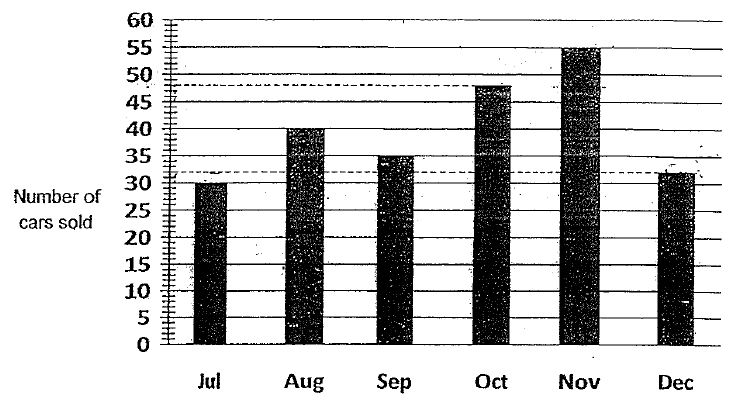
The graph below shows the number of cars sold from July to December.
(a) Find the percentage decrease in sales from November to December, correct your answer to 1 decimal place.
(b) In which months was the number of cars sold more than the average number of cars sold from July to December?
(b) July and December
(b) October and December
(b) November and December
(b) October and November
Sorry. Please check the correct answer below.
(b) October and November
You are Right
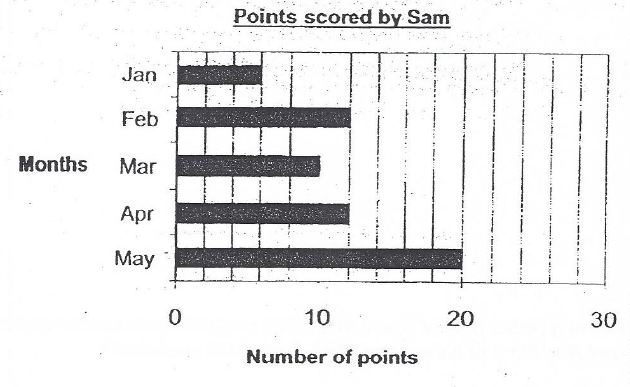
The graph below shows the number of points Sam scored in the basketball matches he played in from January to May.
How many months did sam score at least 10 points?

Sorry. Please check the correct answer below.
You are Right
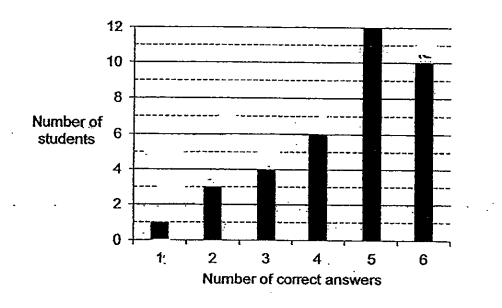
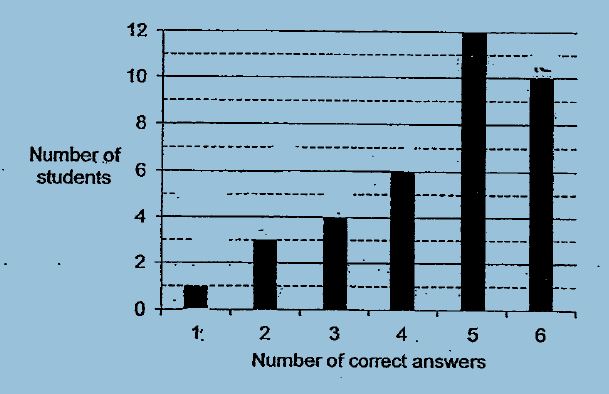
A Class of 36 pupils sat for a test.
Their results are shown in the graph below.
To pass the test, a pupil must obtain at least 4 correct answers.
What fraction of the class failed the test?
Give your answer in the simplest form.
Sorry. Please check the correct answer below.
You are Right
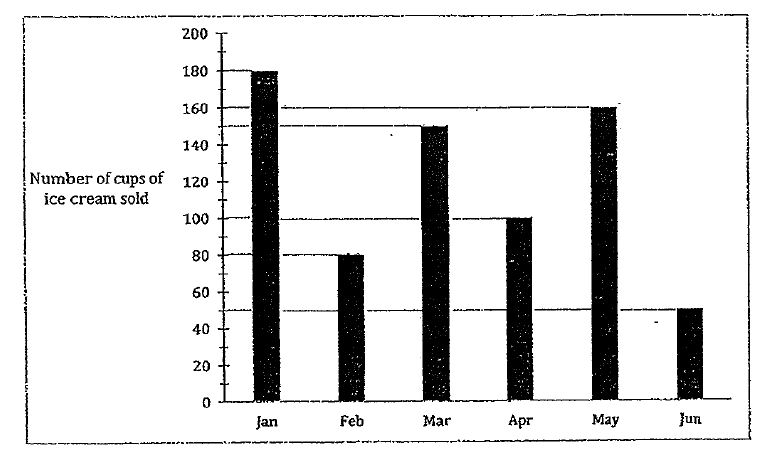
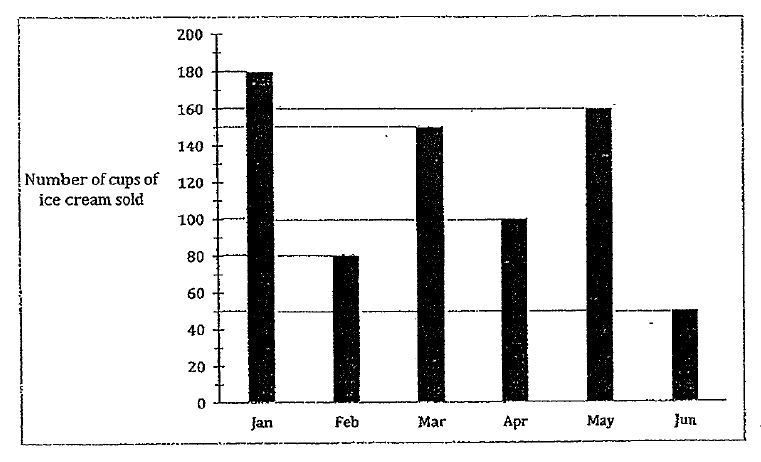
The bar graph shows the number of cups of ice-cream sold over 6 months. A total of $1800 was collected. How much does each cup of ice-cream cost?
Sorry. Please check the correct answer below.
You are Right
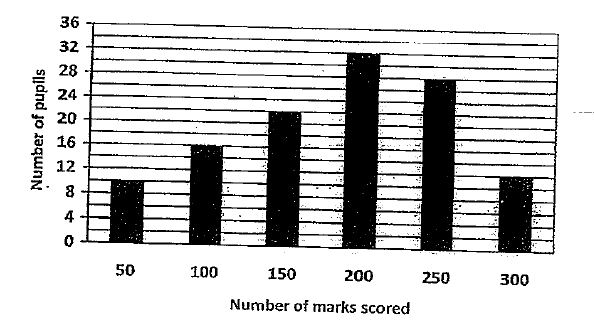
The bar graph below shows the number of marks some pupils scored in a Math quiz. Given that the passing mark was 150, how many pupils passed the Math quiz?
Sorry. Please check the correct answer below.
You are Right
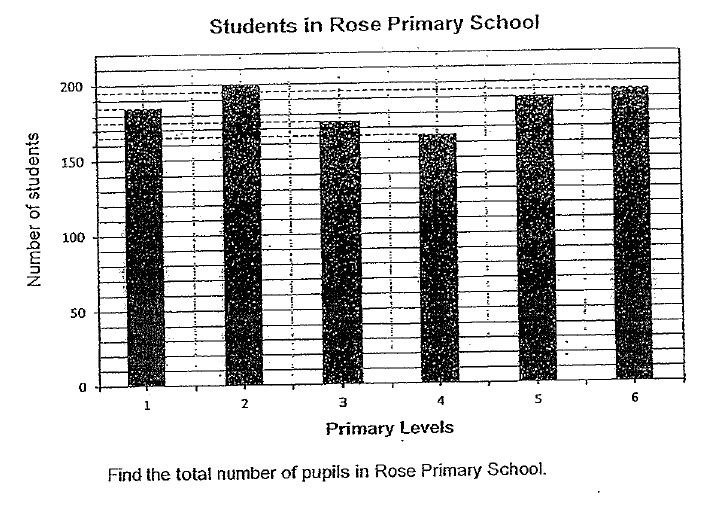
The graph shows the number of students at each level in Rose Primary School.
Find the total number of pupils in Rose Primary School
Sorry. Please check the correct answer below.
You are Right
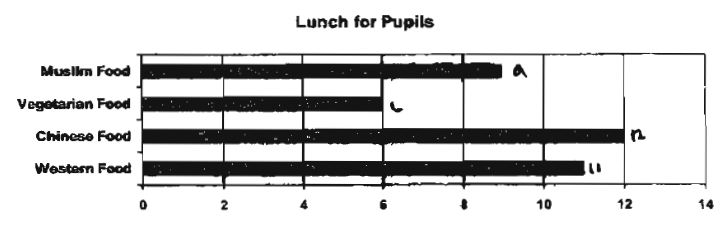
38 children were asked what they had for lunch. The bar graph below shows the children`s. Study it carefully before answering question.
What fraction of the pupils chose vegetarian food?
Give your answer in the simplest form
Sorry. Please check the correct answer below.
You are Right
The graph below shows the family size of the pupils in a class, Study the graph carefully and answer.
There are how many pupils in the class altogether?
Sorry. Please check the correct answer below.
You are Right
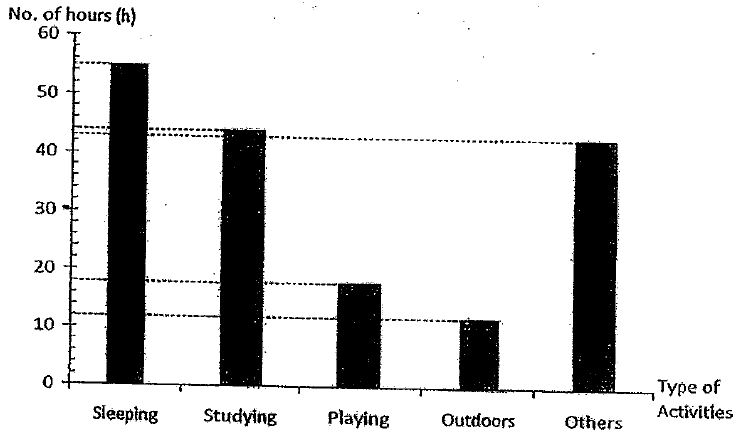
Keegan drew up a bar graph based on the amount of time he spent on each of the activities in 1 week.
a) After totaling up the number of hours that he had recorded in the graph for that week, he realised that he had recorded the time spent on one of the activities wrongly. The time recorded was 10% more than the actual time for that activity. Which activity did he record wrongly?
b) What was the actual time taken for the activity that was recorded wrongly in (a)?
b 60 Hours
b 40 Hours
b 50 Hours
b 45 Hours
Sorry. Please check the correct answer below.
b 40 Hours
You are Right
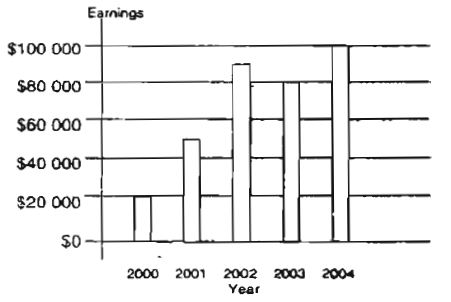
The bar graph below shoes the earning made by a furniture company from 2000 to 2004. In which year was the increase in the earnings the greatest?
Sorry. Please check the correct answer below.
You are Right
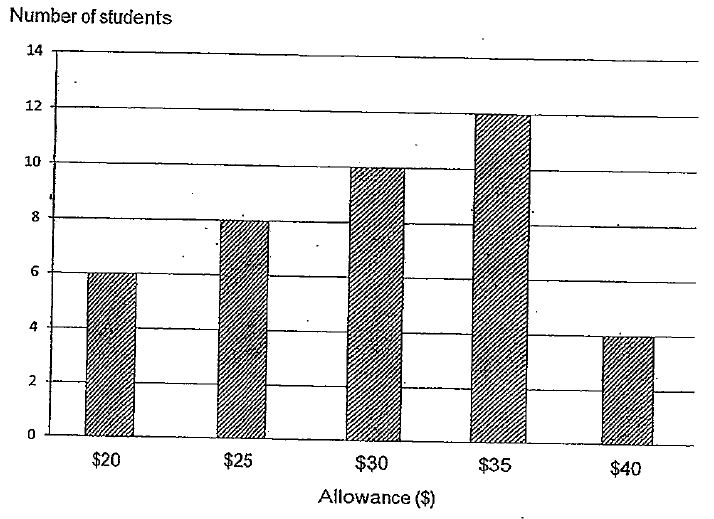
The graph below illustrates the survey findings of the weekly pocket money of a primary 6 class.
(a) Find all number of students in the class.
(b) Calculate the percentage of students whose allowance is $30 or more
b 65%
b 55%
b 45%
b 35%
Sorry. Please check the correct answer below.
b 65%
You are Right
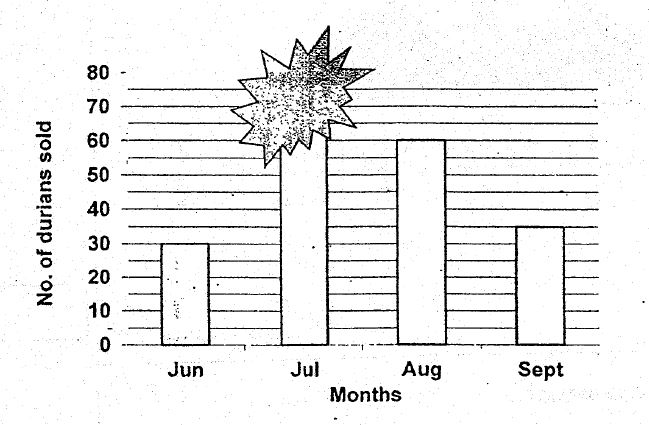
The bar graph below shows the number of durians Mr Tan sold from June to September. The total number of durians sold by Mr Tan from June to Septembers was 200. How many durians were sold in July?
Sorry. Please check the correct answer below.
You are Right
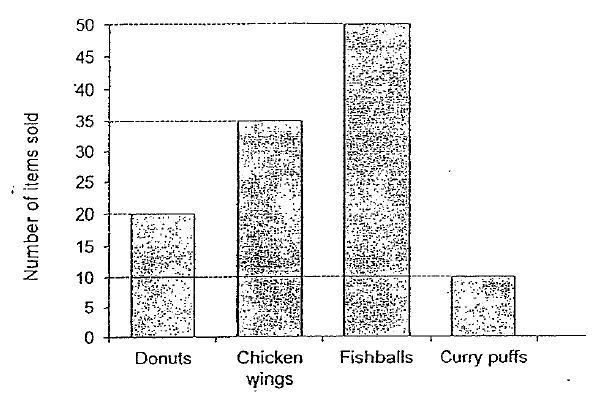
The bar graph below shows the number of food items sold at a carnival.
a Find the total number of items sold at the carnival.
b $97.50 was collected from selling the donuts, chicken wings and fishballs at the carnival. The prices of these items were in the ration 2:3:1.
How much was each chicken wings sold for
b $1.30
b $1.40
b $1.60
b $1.50
Sorry. Please check the correct answer below.
b $1.50
You are Right
The graph below shows the weekly expenditure of three children, James, Pei Hua and Raman. If their weekly allowance is $10 each, what is their total savings?

Sorry. Please check the correct answer below.
You are Right
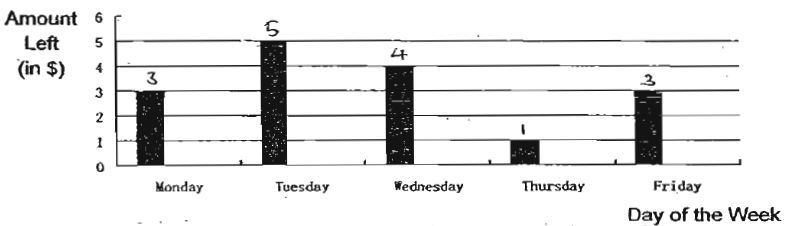
Junming had $6 with him when he went to school every morning. The bar graph below shows the amount of money he had left at the end of each school day. Study it carefully and answer question.
On which day did Junming spend the least amount of his pocket money and how much was this amount?
Sorry. Please check the correct answer below.
You are Right
A class of 36 pupils sat for a test. Their results are shown in the graph below. To pass the test, a pupil must obtain at least 4 correct answers. What fraction of the class failed the test? Give your answer in the simplest form
Sorry. Please check the correct answer below.
You are Right
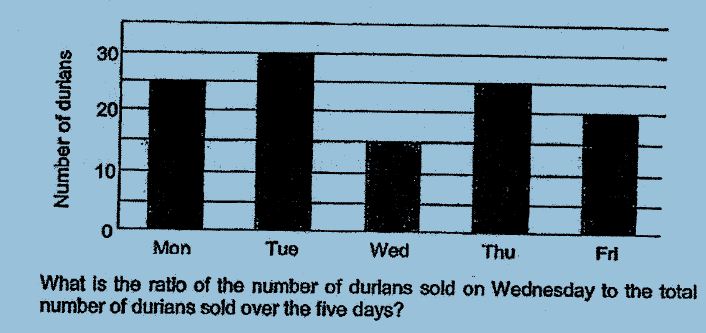
The graph below shows the number of durians sold from Monday to Friday.
What is the ratio of the number of durians sold on Wednesday to the total number of durians sold over the five days?
Sorry. Please check the correct answer below.
You are Right
A Class of 36 pupils sat for a test.
Their results are shown in the graph below.
To pass the test, a pupil must obtain at least 4 correct answers.
What fraction of the class failed the test?
Give your answer in the simplest form

Sorry. Please check the correct answer below.
You are Right
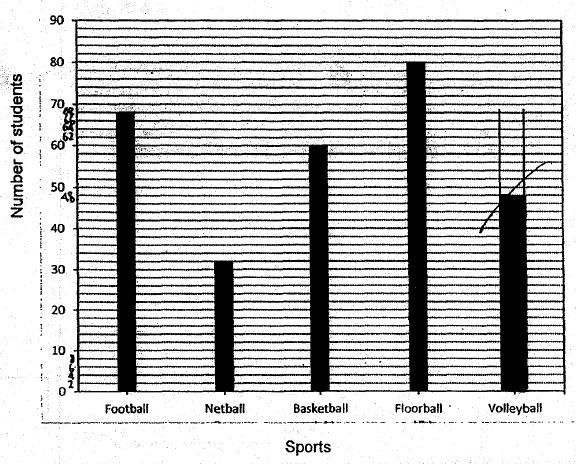
The bar graph below shows the results of a survey on the favourite sports of a group of students. $\frac{1}{6}$ of the students chose volleyball as their favourite sport.
Draw the bar in the graph to show the number of students who chose volleyball as their favourite sport
Sorry. Please check the correct answer below.
You are Right
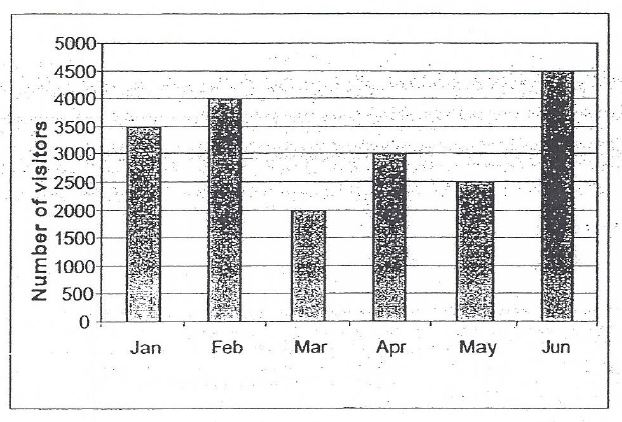
The bar graph below shows the number of visitors who visited a carnival for the first 6 months of the year.
In June, $\frac{1}{6}$ of the visitors were adults, and the number of boys was the same as the number of visitors in March. What fraction of the visitors in June were girls?
Sorry. Please check the correct answer below.
You are Right
A school conducted an immunisation exercise for its primary 5 pupils from Monday to Thursday. Each of them had their immunisation oin one of the four days.
The bar graph below shows the number of pupils that had immunisation from Monday to Thursday.
a What percentage of the pupils had their immunisation on Wednesday
b Express the number of pupils who had their immunisation on Thursday as a fraction of those who had theirs on Tuesday. Leave your answer in its simplest form

Sorry. Please check the correct answer below.
You are Right
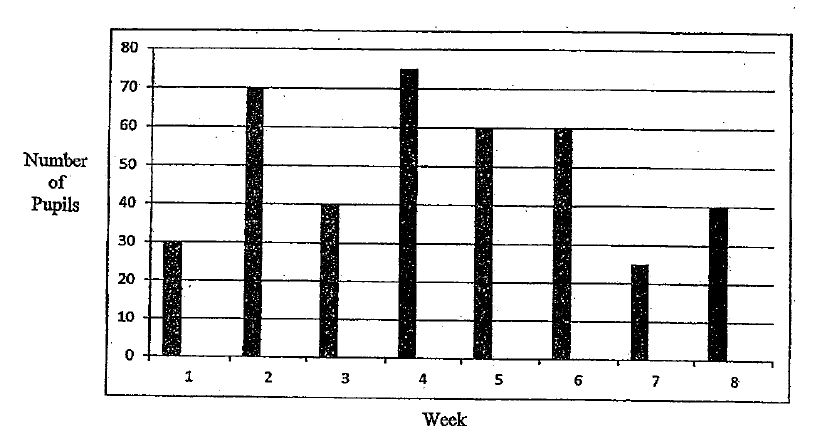
The bar graph shows a total of 400 pupils involved in a Fund raising project over a period of 8 weeks. Study the graph carefully and answer the question
In which week was there 3 times as many pupils involved in the Fund Raising Project as in the 7th week?
Sorry. Please check the correct answer below.
You are Right
The bar graph shows the number of cups of ice-cream sold over 6 months. A total of $1800 was collected. How much does each cup of ice-cream cost?
Sorry. Please check the correct answer below.
You are Right
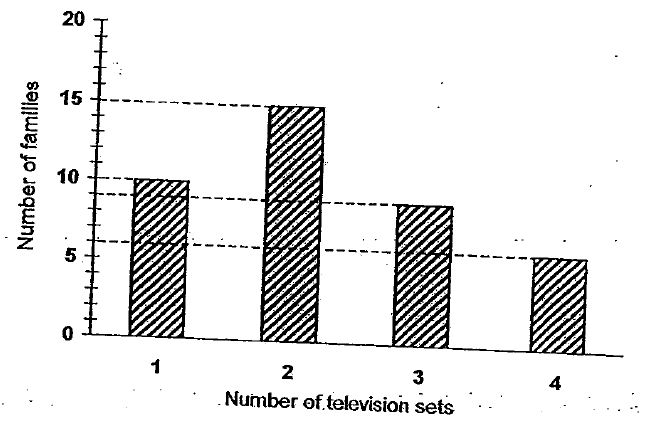
The bar graph below shows the number of television sets owned by some families in a neighbourhood.
a What percentage of the families owned at least 2 television sets?
b What is the average number of television sets owned by the families in the neighbourhood?
round off your answer to the nearest whole number
b 2
b 2
b 3
b 4
Sorry. Please check the correct answer below.
b 2
You are Right
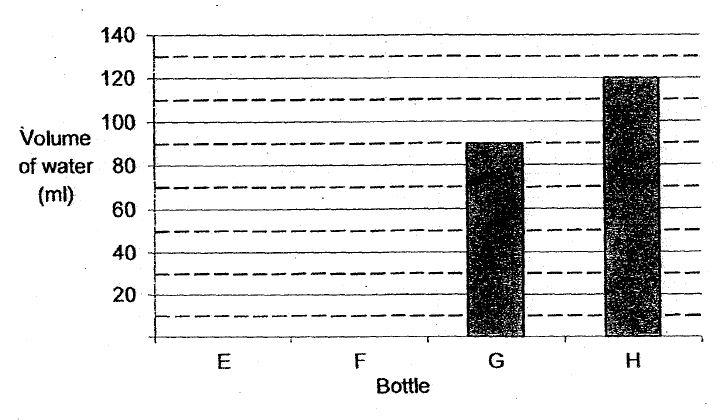
Shi Jin has 4 bottles labelled E, F, G and H respectively. The bar graph below shows the volume of water in each bottle. The bars that show the volume of water in Bottle E and bottle F have not been drawn.
The ratio of the volume of water in Bottle E to the total volume of water in the 4 bottles is 2:9. Bottle F contains 40ml more water than bottle E. Find the total volume of water in the 4 bottles.
Sorry. Please check the correct answer below.
\begin{array}{rcl} E&\rightarrow&2u\\ F&\rightarrow&2u+40\\ G&\rightarrow&90\\ H&\rightarrow&120\\ Total&\rightarrow&9u \end{array}
You are Right
\begin{array}{rcl} E&\rightarrow&2u\\ F&\rightarrow&2u+40\\ G&\rightarrow&90\\ H&\rightarrow&120\\ Total&\rightarrow&9u \end{array}
The graph below shows the time taken by 6 children to complete a race. What is the total time taken by the top 4 runners to complete the race?
Sorry. Please check the correct answer below.
You are Right
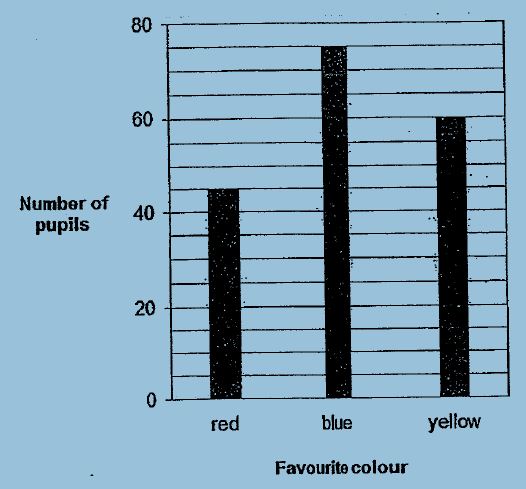
180 pupils were asked to choose their favourite colour. The bar graph below shows the number of pupils who chose each of the colours.
What percentage of the pupils chose red as their favourite colour?
Sorry. Please check the correct answer below.
You are Right
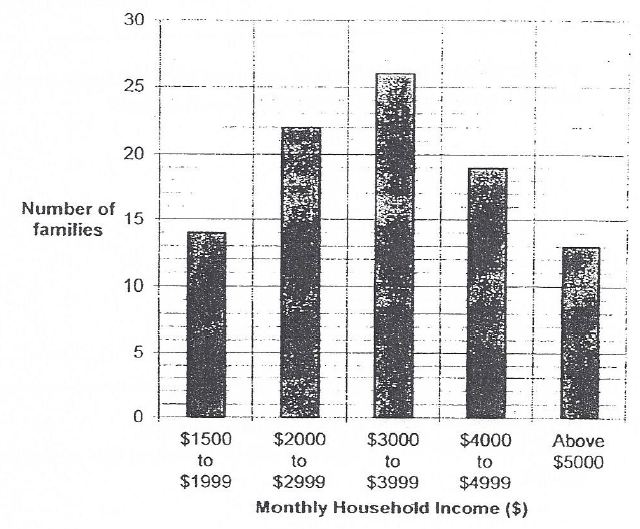
The graph below shows the monthly household income of some families in a housing estate.
How many families have a monthly household income of more than or equal to $4000 per month?
Sorry. Please check the correct answer below.
You are Right
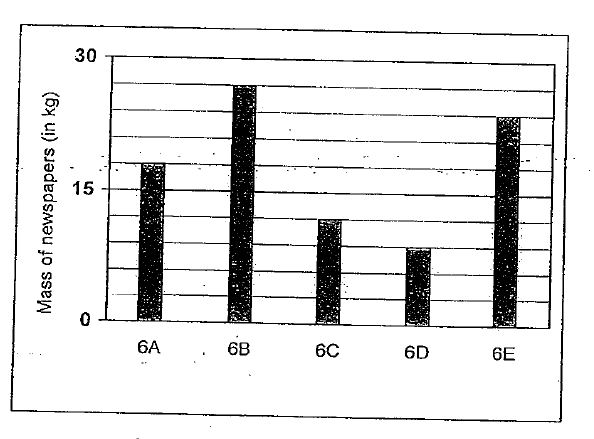
The graph below shows the mass of newspapers collected by five classes in a recycling project. Another two classes, 6F and 6G collected a total of 36 kg of newspapers. What was the average mass of newspapers collected by all the 7 classes?
Sorry. Please check the correct answer below.
You are Right
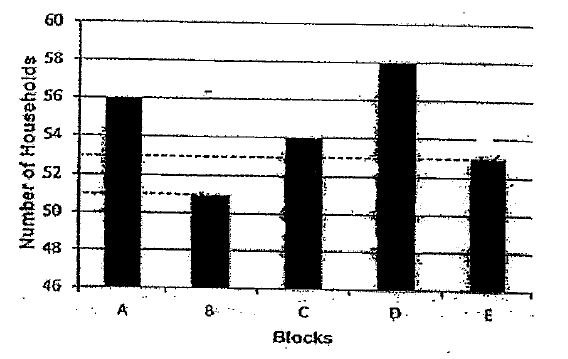
The average number of households in a block of flats in 58. The bar graph shows the number of households which own a vehicle. How many households do not own a vehicle?
Sorry. Please check the correct answer below.
You are Right
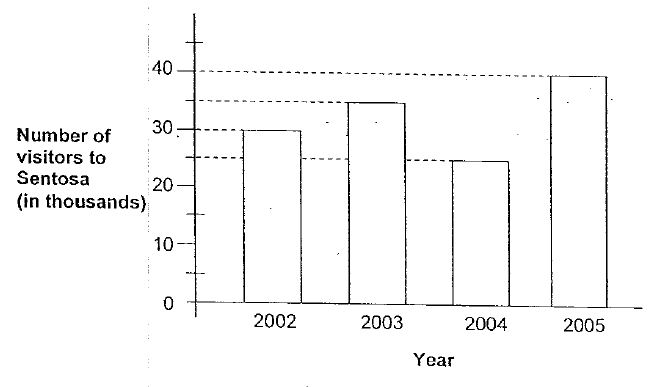
The bar graph shows the number of visitors to Sentosa from 2002 to 2005. How many visitors were there in 2004?
Sorry. Please check the correct answer below.
You are Right
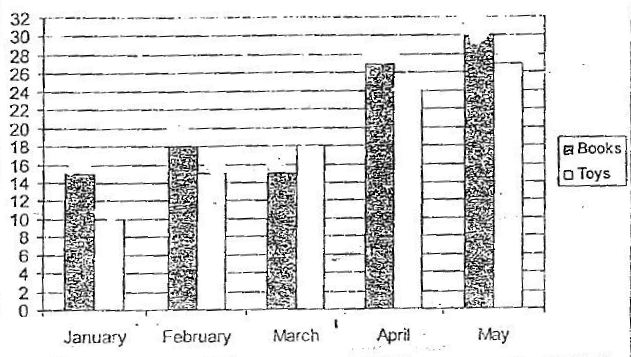
The bar graph below shows the number of books and toys sold by a bookstore over a period of five months. Use the graph to answer.
What was the percentage increase in the number of books sold from January to February?

Sorry. Please check the correct answer below.
You are Right
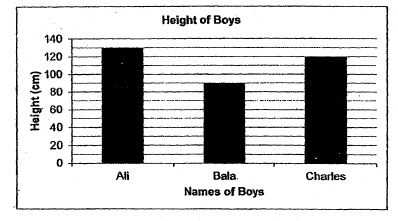
The graph below shoes the height of 3 boys Ali, Bala and Charles. Find the total height of Ali and Charles.
Sorry. Please check the correct answer below.
You are Right
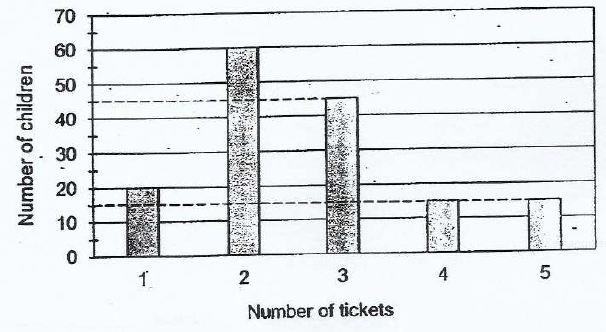
The bar graph below shows the number of tickets sold for a concert to a group of children. How many children purchased more than 2 tickets?
Sorry. Please check the correct answer below.
You are Right
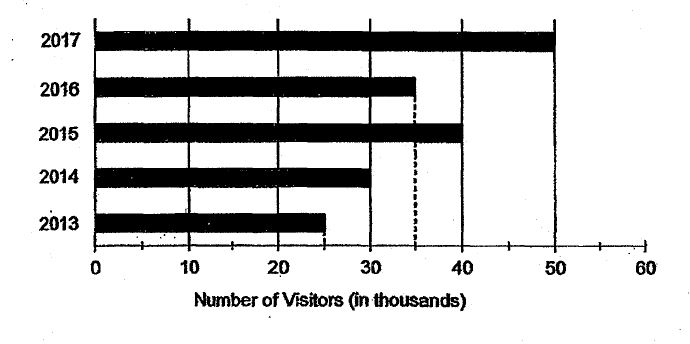
The bar graph shows the number of visitors to a zoo from 2013 to 2017. During which one-year period was the increase in the number of visitors the greatest?
Sorry. Please check the correct answer below.
You are Right
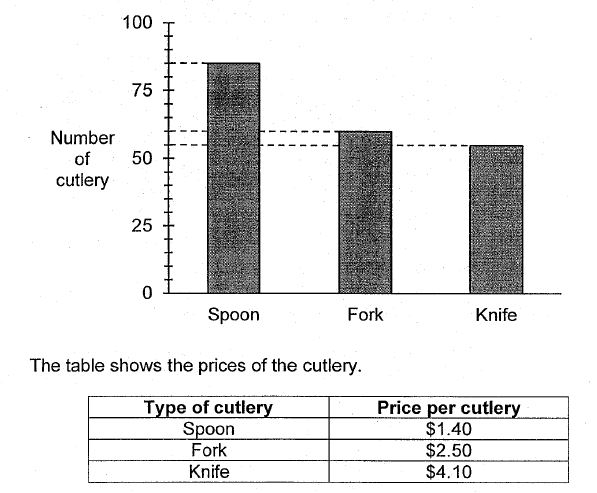
The bar graph shows the number of each type of cutlery sold in a shop. The table shows the prices of the cutlery.
(a) How many more spoons than knives were sold?
(b) Find the average amount of money collected from the cutlery sold. Round off your answer to the nearest dollar
(b) $4
(b) $8
(b) $3
(b) $2
Sorry. Please check the correct answer below.
(b) $2
You are Right
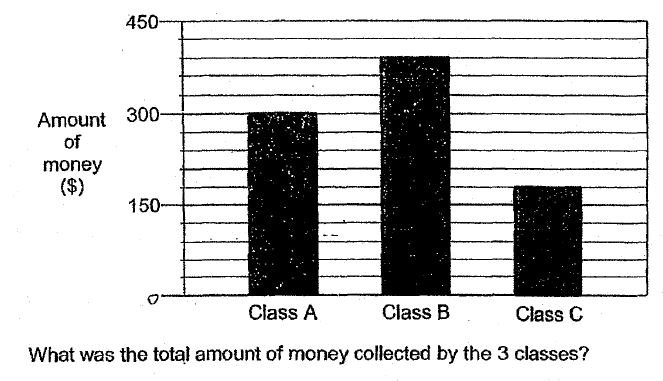
The graph shows the amount of money collected by 3 class for a charity.
What was the total amount of money collected by the 3 classes?
Sorry. Please check the correct answer below.
You are Right
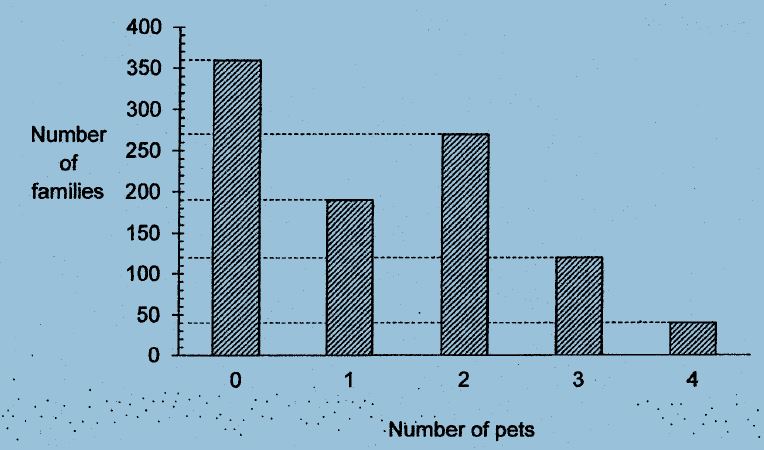
The bar graph shows the number of pets owned by families in a neighbourhood.
(a) How many pets are there in the neighbourhood altogether?
(b) What fraction of the families who own pets, have at least 3 pets?
Give your answer in the simplest form.
(b )$\frac{8}{31}$
(b )$\frac{8}{31}$
(b )$\frac{8}{31}$
(b )$\frac{8}{31}$
Sorry. Please check the correct answer below.
(b )$\frac{8}{31}$
You are Right
The bar graph below shows the number of books and toys sold by a bookstore over a period of five months. Use the graph to answer.
In which month was the ratio of the number of books to the number of toys sold 9:8?
Sorry. Please check the correct answer below.
You are Right
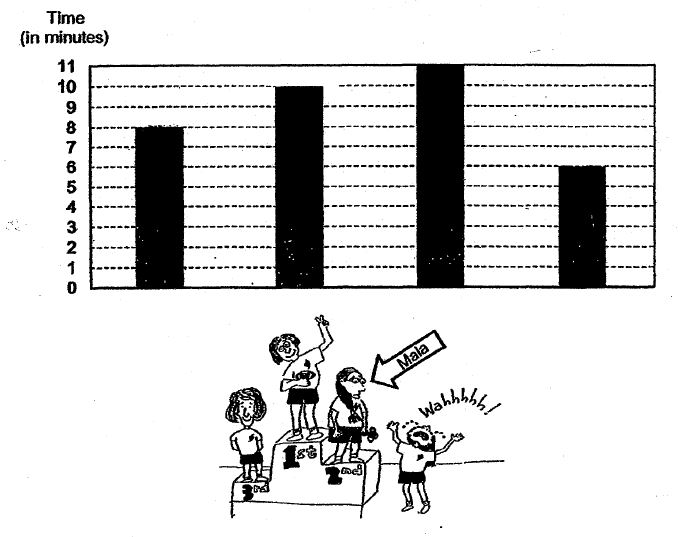
The bar graph below shows the timing (in) (minutes) taken by 4 girls to complete a 800 m race.
Mark the proper option the time taken by mala to complete the race
Sorry. Please check the correct answer below.
You are Right
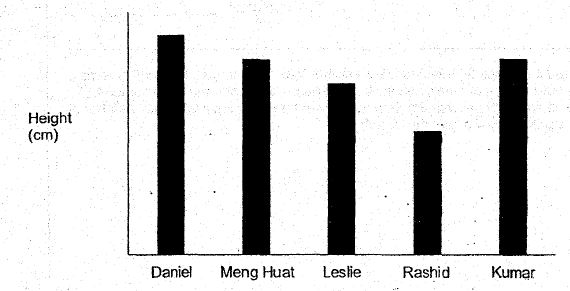
The bar graph below shows the height of 5 boys. Based on the information below, put a tick mark in the correct box.
(a) Leslie`s height is less than Rashid`s height.
(b) The average height of the 5 boys is more than Rashid`s height but less than Daniel`s height
(b) True
(b) True
(b) False
(b) False
Sorry. Please check the correct answer below.
(b) True
You are Right
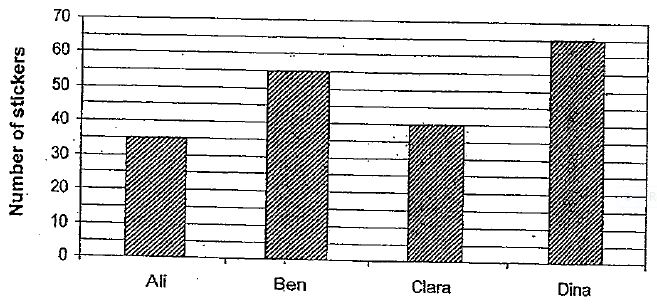
The bar graph shows the number of stickers each child has. How many stickers must Dina give Ali so that both of them will have the same number of stickers
Sorry. Please check the correct answer below.
You are Right
The bar graph shows the number of visitors to a zoo from 2013 to 2017. From 2013 to 2017, for how many years did the zoo receive more than 30000 visitors

Sorry. Please check the correct answer below.
You are Right
The graph below shows the number of points Sam scored in the basketball matches he played in from January to May.
What is the average number of points Sam scored per month from January to May
Sorry. Please check the correct answer below.
You are Right
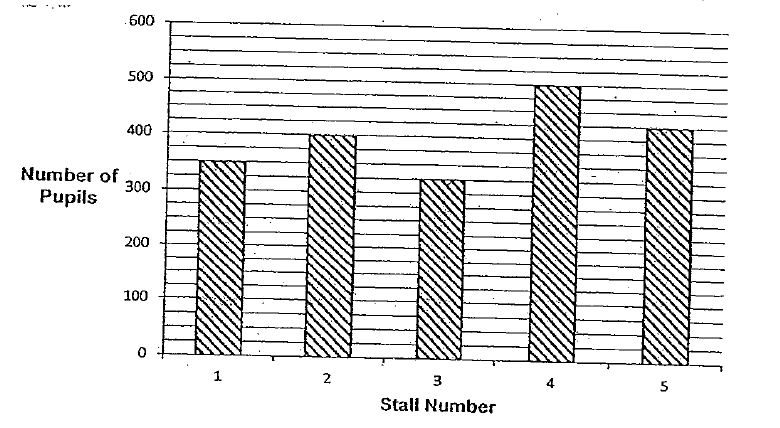
The graph below shoes the number of pupils who shopped at the 5 stalls in a certain school on Friday. Study the graph carefully and answer the questions.
(a) How many more pupils preferred stall 5 to stall 3?
(b) What was the percentage of the pupils who shopped at stall 4?
b 50%
b 25%
b 75%
b 50%
Sorry. Please check the correct answer below.
b 25%
You are Right
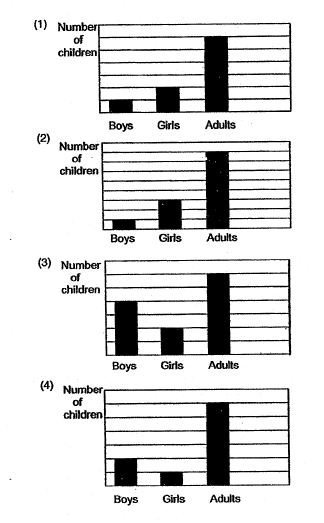
There are twice as many boys as girls. There are twice as many adults as chldren.
Which one of the following bar graphs shows the above information correctly?
Sorry. Please check the correct answer below.
You are Right
The bar graph below shows the numbers of cars sold by ABC company. Given that a total of 129 cars were sold from January to April, how many cars were sold in April?
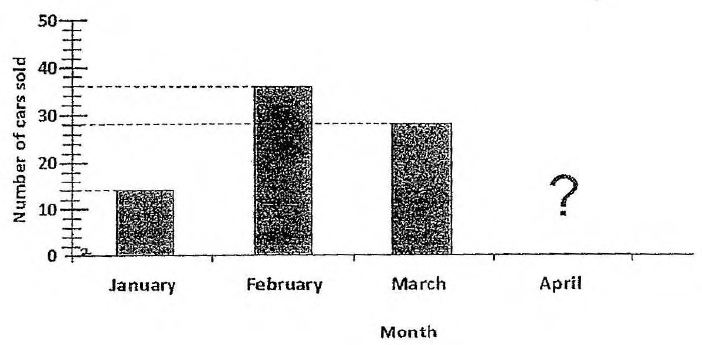
Sorry. Please check the correct answer below.
You are Right
The bar graph below shown the number of stamps collected by 5 members of a local stamp club in the month of October.
a Find the average number of stamps the members collected in the month of October
b The total number of stamps collected by the 5 members in November is the same as in October. However, a new member joined the stamp club and the average member of stamps collected by each member became 89. How many stamps did the new member collect in November?
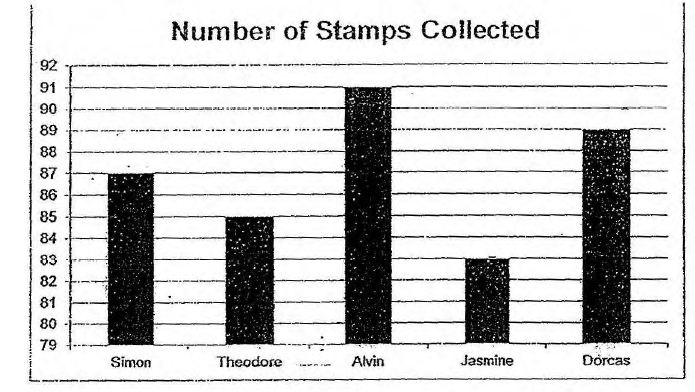
b 99 stamps
b 87 stamps
b 99 stamps
b 97 stamps
Sorry. Please check the correct answer below.
b 99 stamps
You are Right
Aggie had a roll of ribbon. She used some of it each day for 4 days. At the end of each day, she measured and recorded the length of ribbon left in the bar graph below. Based on the information below, put a tick in the correct option.
(a) The length of the original roll of ribbon is 80cm.
(b) The total length of ribbon used over the 4 days is 60 cm
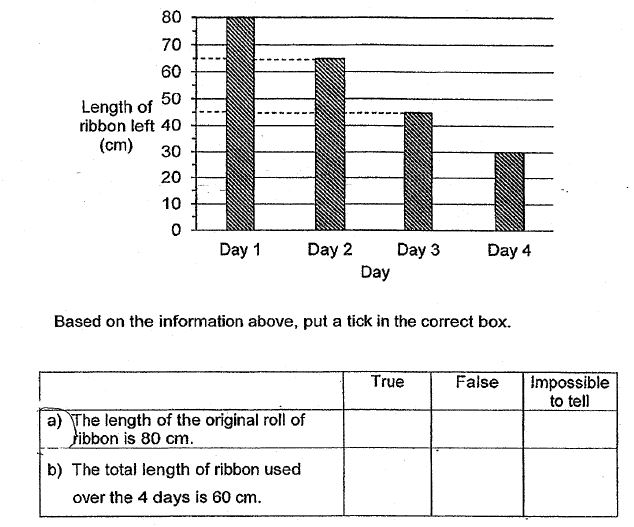
(b) Impossible to tell
(b) true
(b) Impossible to tell
(b) Impossible to tell
Sorry. Please check the correct answer below.
(b) Impossible to tell
You are Right
The bar graph shows the number of students playing in the various sports during the school`s games day. $\frac{1}{4}$ of the students play soccer. Draw the bar that shows the number of students who play soccer
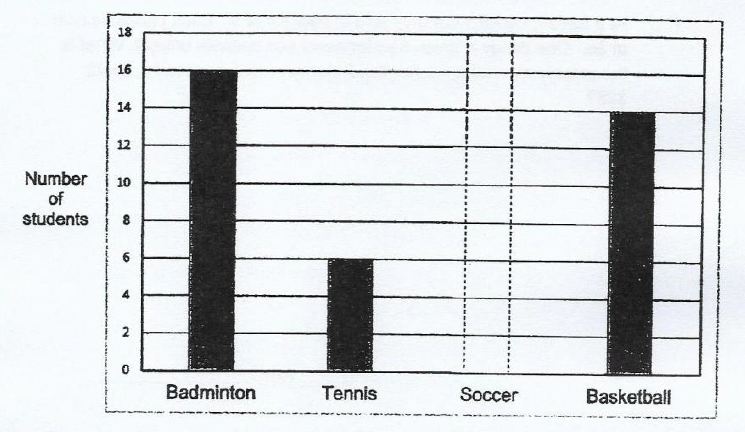
Sorry. Please check the correct answer below.
You are Right
PSLE-Math.com
Start winning at math! Be part of Singapore PSLE Math community and Unleash the Your Maths Potential!
General
2026 © All Rights Reserved. Privacy Policy | Terms of Service
What subject area do you need help in?
Select level
Select subject