- Numbers
- What does the number stand for?
- Nearest number
- Which digit is in the place?
- Round off to the nearest number
- Number divide
- Find the fraction nearest to 1
- Sort fraction numbers
- Find the largest or smallest fraction
- Fraction to decimal
- Convert decimal to a mixed fraction.
- Fraction - Addition
- Fraction - Substraction
- Fraction - Multiply
- Fraction - Divide
- List all the common factors of two integers
- Chicken and Rabbit problem
- Assumption Method
- Measurement
- Data Analysis
- Geometry
- Speed
- Others
- P5 Maths
- P4 Maths
- Tap to switch levels
- Numbers
- Measurement
- Data Analysis
- Geometry
- Speed
- Others
- P5 Maths
- P4 Maths
SELECT A SUBJECT
- Numbers
Question 1 of 29
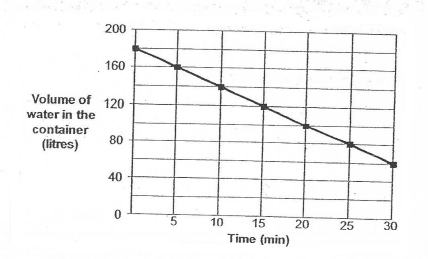
A container was completely filled with water. Some water in the container was drained using a tap at the bottom of the container. After 30 minutes, the tap was then turned off.
The line graph shown the volume of water in the container over 30 minutes.
(a) How many litres of water flowed out of the container in one minutes?
(b) The tap was turned on again to drain water from the container at the same rate as before. How many minutes did it take for the container to be empty?
(b) 5
(b) 8
(b) 12
(b) 15
Sorry. Please check the correct answer below.
(b) Liter of water flown out ? 180 – 6 = 120, 1 min $\rightarrow$ 120 ÷ 30 = 4, (remain) (Minutes) $\rightarrow$ 60 ÷ 4 = 15
(b) 15
You are Right
(b) Liter of water flown out ? 180 – 6 = 120, 1 min $\rightarrow$ 120 ÷ 30 = 4, (remain) (Minutes) $\rightarrow$ 60 ÷ 4 = 15
The line graph shown the amount of water used by the Poh family for the first 6 month of this year. The amount of water used is charged at \$1.00 per cubic meters. How much did the Poh family pay for the water used for the months of May and June if they also had to pay 7% GST?

Sorry. Please check the correct answer below.
You are Right
Alan took part in a 100m freestyle swimming race. His performance was shown in the line graph below. What was his average speed for the whole swimming race?
Sorry. Please check the correct answer below.
You are Right
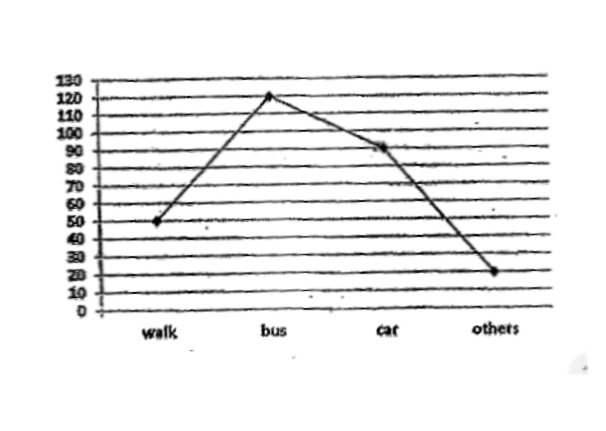
The line graph shows how a group of pupils goes to school. What fraction of the pupils go to school by car?
Sorry. Please check the correct answer below.
20 + 90 + 120 + 50 = 280
$\frac{90}{280}$ = $\frac{9}{28}$
You are Right
20 + 90 + 120 + 50 = 280
$\frac{90}{280}$ = $\frac{9}{28}$
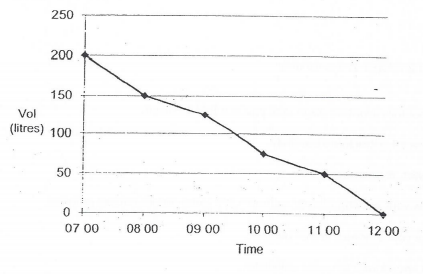
A 200-litre tank was completely filled with water at 07:00. Water flowed out of the tank until it was completely empty at 12:00. The line graph below shows the rate of the water. At what time was tank 25% filled with water?
Sorry. Please check the correct answer below.
100 $\rightarrow$ 200 ÷ 100 = , 2 x 25 = 50
You are Right
100 $\rightarrow$ 200 ÷ 100 = , 2 x 25 = 50
The graph below shows the messes when different objects, A, B and C are placed in the same container.
What is the mass of objects C?
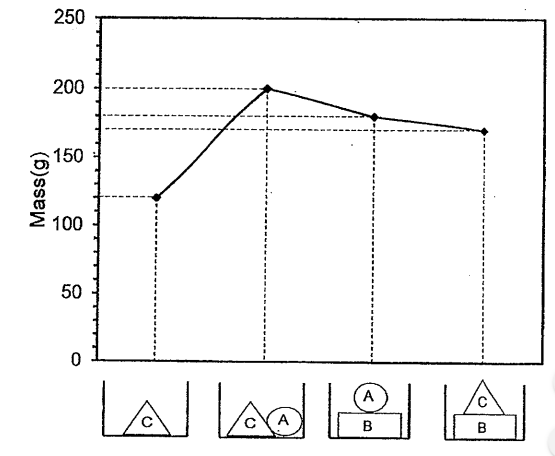
Sorry. Please check the correct answer below.
You are Right
The line graph below shown the amount of rain collected in a town from January to June
How many percent more rain was collected in January than in March?
Sorry. Please check the correct answer below.
50% $\rightarrow$ January $\rightarrow$ 255, March $\rightarrow$ 170, 255-170 = 85, $\frac{85}{170}$ = 50%
You are Right
50% $\rightarrow$ January $\rightarrow$ 255, March $\rightarrow$ 170, 255-170 = 85, $\frac{85}{170}$ = 50%
The line graph shows the volume of water in a tank from 11 am to 3pm. The tank was completely filled with water at 12pm. Water was then allowed to flow out of the tank. At what timE was there only 50% of water left in the tank?
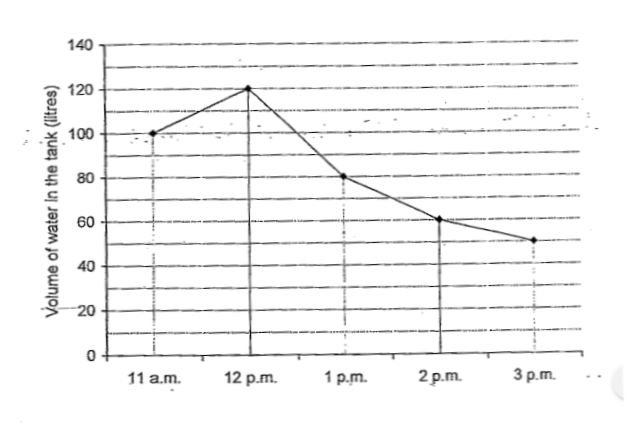
Sorry. Please check the correct answer below.
100% of water is at 10pm
50% of water = $\frac{50}{100} \times 120L = 60L$
Time at which water is left 60L = 2pm
You are Right
100% of water is at 10pm
50% of water = $\frac{50}{100} \times 120L = 60L$
Time at which water is left 60L = 2pm
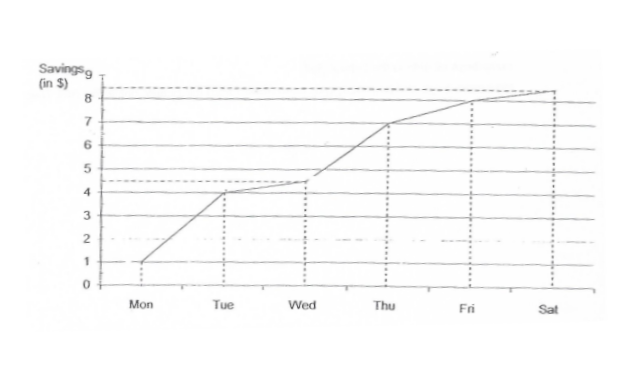
Fatima was given $5 pocket money every day. The line graph below shown the total amount of savings she had at the end of each day for a particular week.
(a) How much did Fatima spend on Monday?
(b) On which two days Fatima save the same amount of money?
(c) What was the average amount she saved from Tuesday to Saturday?
(b) Saturday and Wednesday
(c) \$ 0.50
(b) Sunday and Thursday
(c) \$ 1
(b) Monday and Friday
(c) \$ 1.50
(b) Tuesday and Saturday
(c) \$ 2
Sorry. Please check the correct answer below.
(a) \$4 $\rightarrow$ 5 – 1 = 4
(b) Monday and Friday (c) \$1.50 $\rightarrow$ 3 + 0.5 + 2.5 + 1 + 0.5 = 7.5 ÷ 5 = 1.5
(b) Monday and Friday
(c) \$ 1.50
You are Right
(a) \$4 $\rightarrow$ 5 – 1 = 4
(b) Monday and Friday (c) \$1.50 $\rightarrow$ 3 + 0.5 + 2.5 + 1 + 0.5 = 7.5 ÷ 5 = 1.5
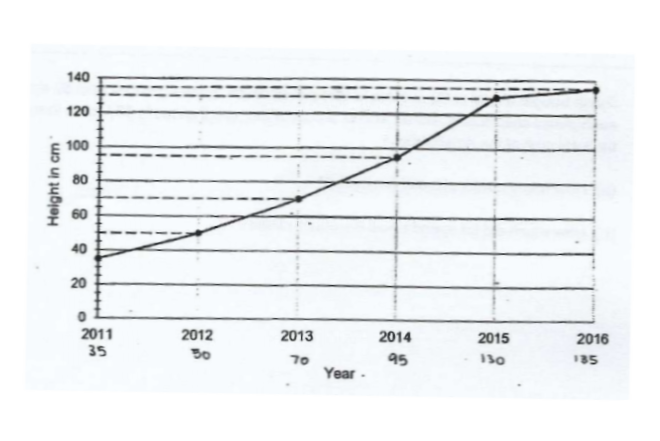
The line graph below shows the height of a mango tree measured in January of each year from 2011 to 2016
(a) In which year was the height the mango tree twice its height in 2011?
(b) What was the average height of the mango tree from 2012 to 2015?
(b) 86.25cm
(b) 87.00cm
(b) 87.25cm
(b) 88.00cm
Sorry. Please check the correct answer below.
(a) Height of mango tree in 2011
Total height $\rightarrow$ 35cm
2 times the height $\rightarrow$ 2 x 35cm = 70cm $\rightarrow$ In yeas 2013
(b) Total height $\rightarrow$ 50 + 70 + 95 + 130 = 345cm
Avg. height $\rightarrow$ 435 ÷ 4 $\rightarrow$ 86.25cm
(b) 86.25cm
You are Right
(a) Height of mango tree in 2011
Total height $\rightarrow$ 35cm
2 times the height $\rightarrow$ 2 x 35cm = 70cm $\rightarrow$ In yeas 2013
(b) Total height $\rightarrow$ 50 + 70 + 95 + 130 = 345cm
Avg. height $\rightarrow$ 435 ÷ 4 $\rightarrow$ 86.25cm
The line graph below shown the number of visitors in a shopping mall from February to June.
What is the increase in the number of visitors from April to June?
Sorry. Please check the correct answer below.
750 $\rightarrow$ 2500 – 1750 = 750
You are Right
750 $\rightarrow$ 2500 – 1750 = 750
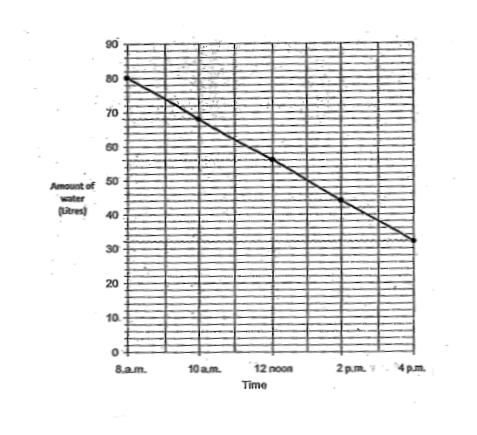
Water was leaking from a tank in a water company. The line graph below shows the amount of water in the tank over a period of 8 hours. Given that the company had to pay a fine of \$12 for every 4 liters of water leaked, how much fine did the water company pay from 8 am to 4 pm?
Sorry. Please check the correct answer below.
You are Right
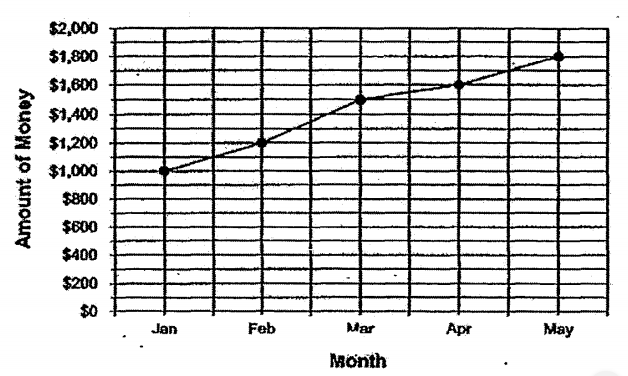
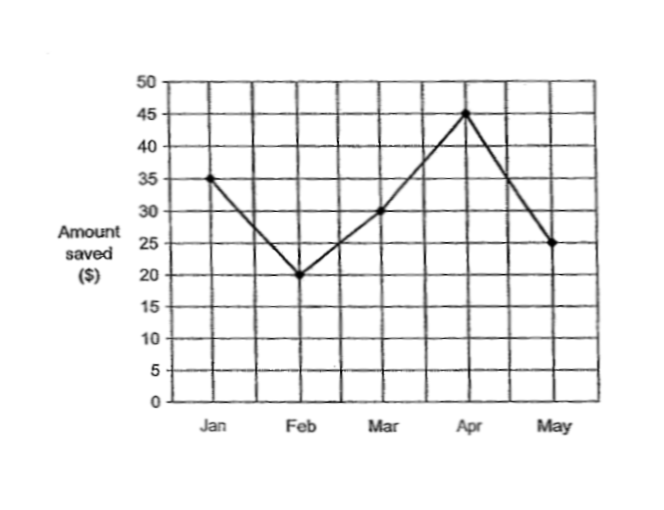
Since January, David deposits his savings into his bank account every month. The graph below shows the amount of money in David’s bank account at the end of each month from January to May. Give that David’s monthly salary is \$4500 what percentage of David’s salary did he save in March?
Sorry. Please check the correct answer below.
$\frac{300}{4500}\times100 = 6$ = $\frac{2}{3}$
You are Right
$\frac{300}{4500}\times100 = 6$ = $\frac{2}{3}$
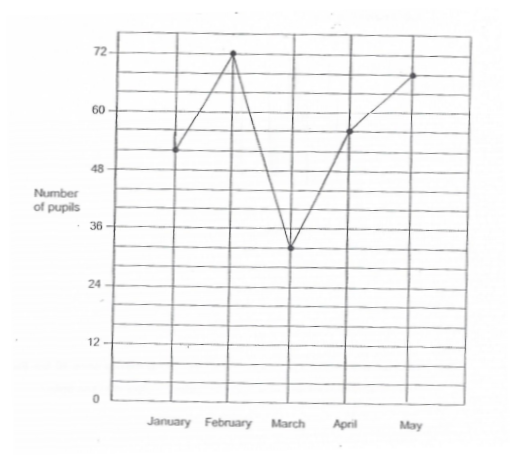
The line graph below shown the number of pupils who joined a Mathematics workshop from January to May.
From January to May, the number of boys who joined the workshop was $\frac{3}{5}$ of the number of girls. What was the number of boys who joined the workshop during that period?
Sorry. Please check the correct answer below.
You are Right
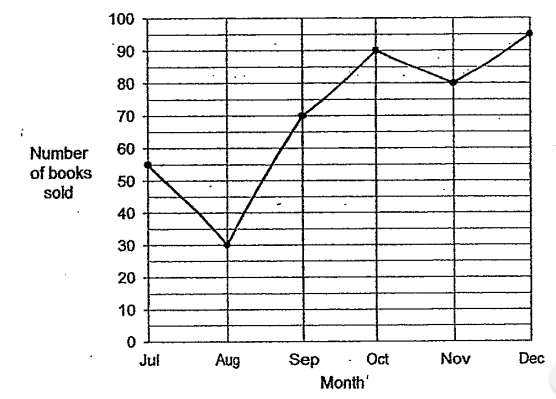
The line graph below shows the number of books sold by a shop from July to December in 2003.
(a) What was the average number of books sold per month from July to December in 2003?
(b) The total number of books sold for the same period from July to December in 2012 was 672. Find the percentage decrease in the total number of books sold for the same period from 2012 to 2013.
(b) 34%
(b) 35.5%
(b) 37.5%
(b) 38%
Sorry. Please check the correct answer below.
(a) 55 + 3 + 70 + 90 + 80 + 95 = 420
420 ÷ 6 = 70
(b) 672 – 420 =252
$\frac{252}{672} \times 100 = 37.5%$
(b) 37.5%
You are Right
(a) 55 + 3 + 70 + 90 + 80 + 95 = 420
420 ÷ 6 = 70
(b) 672 – 420 =252
$\frac{252}{672} \times 100 = 37.5%$
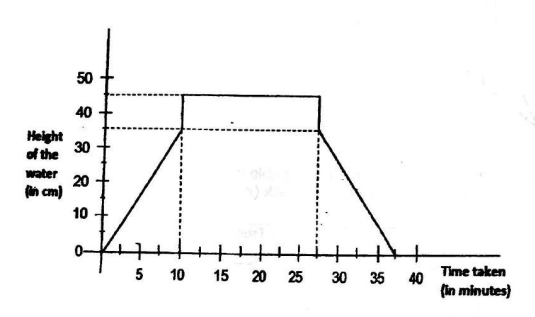
The graph below shown the height of water in a bathtub at different times of Sally’s bathing activity. The height of the bathtub was 50 cm. She switched on the tap to fill the bathtub. She switched off the tap and stepped into the tub. After bath, she stepped out of the bathtub and drained the water.
(a) What fraction of the height of the bathtub was filled with water when sally switched off the tap? Give your answer in the simplest form.
(b) How long did sally in the bathtub?
(b) 17min
(b) 17.5min
(b) 18min
(b) 18.5min
Sorry. Please check the correct answer below.
(b) 17.5min
You are Right
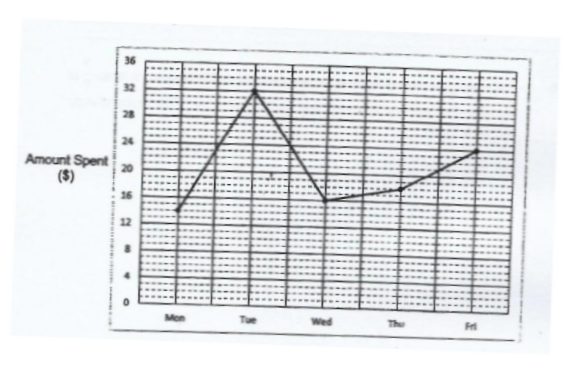
Susan received \$40 each day for food and transport. She saved the rest of the amount of money after she spent on food and transport. The graph shows the daily amount of money she spent from Monday to Friday.
(a) What is the difference between the amount Susan spent on Wednesday and Friday?
(b) What was the total amount of money she saved on Monday and Tuesday?
(c) Write down all the days in which Susan saved more than half of her daily amount of money.
(b) \$24
(c) Sat, Mon, Fri
(b) \$29
(c) Sun, Wed, Thu
(b) \$34
(c) Mon, Wed, Thu
(b) \$38
(c) Thu, Wad, Fri
Sorry. Please check the correct answer below.
(a) 24 – 16 = \$8
(b) 40 – 14 = 26, 40 – 32 = 8, 26 + 8 = \$34
(c) Mon, Wed, Thu
(b) \$34
(c) Mon, Wed, Thu
You are Right
(a) 24 – 16 = \$8
(b) 40 – 14 = 26, 40 – 32 = 8, 26 + 8 = \$34
(c) Mon, Wed, Thu
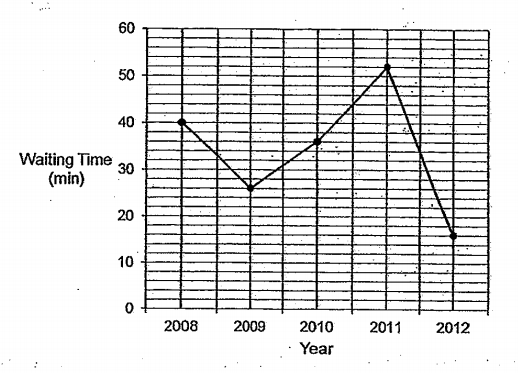
The line graph below shows the average waiting time from 2008 to 2012 for the patients at the emergency department of a hospital.
(a) What was the difference between the longest waiting time and the shortest waiting time during the period from 2008 to 2012?
(b) Find the percentage increase in waiting time for a patient between 2009 and 2010. Give your answer correct to 1 decimal place.
(b) 38%
(b) 38.5%
(b) 39%
(b) 39.5%
Sorry. Please check the correct answer below.
(a) Longest $\rightarrow$ 2011 = 52min
Shortest $\rightarrow$ 2012 = 16min
Diff $\rightarrow$ 52 – 16 = 36min
(b) Diff $\rightarrow 16 \div 26 \times 100\% = 38.5\%$
(b) 38.5%
You are Right
(a) Longest $\rightarrow$ 2011 = 52min
Shortest $\rightarrow$ 2012 = 16min
Diff $\rightarrow$ 52 – 16 = 36min
(b) Diff $\rightarrow 16 \div 26 \times 100\% = 38.5\%$
The line graph below shows the amount of money collected during a donation drive from Tuesday to Sunday. Express the amount of money collected on Tuesday as a fraction of the amount of money collected on Saturday. Give your answer in its simplest form.
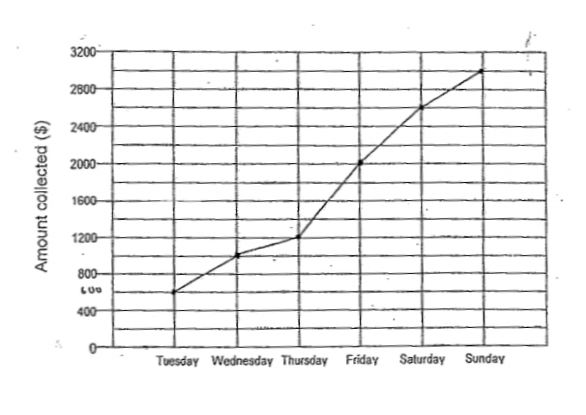
Sorry. Please check the correct answer below.
You are Right
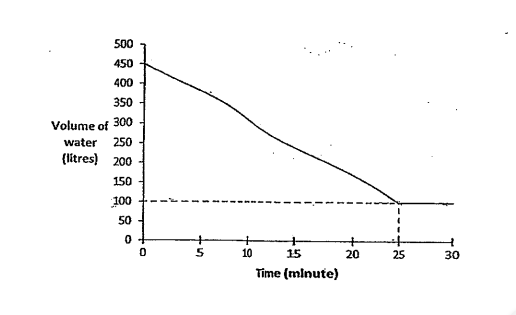
A tank was completely filled with water. The water was drained out of the tank at a constant rate for 25 minutes. The graph below shows the volume of water in the tank over a period of minutes.
(a) what fraction of the tank was filled with water at the end of 25 minutes? Express your answer in the simplest form.
How many liters of water was drained out of the tank in 1 minute?
(b) 14
(b) 20
(b) 26
(b) 29
Sorry. Please check the correct answer below.
(a) $\frac{100}{450}$ = $\frac{2}{9}$
(b) 450 – 100 = 350
350 ÷ 25 = 14
(b) 14
You are Right
(a) $\frac{100}{450}$ = $\frac{2}{9}$
(b) 450 – 100 = 350
350 ÷ 25 = 14
Krishnan received \$120 from his father each month for his pocket money. The line graph below shown the amount of pocket money he saved each month. Write down all the months in which Krishnan saved more than 25% of his pocket money.
Sorry. Please check the correct answer below.
You are Right
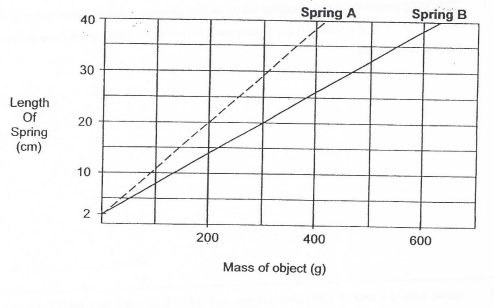
The graph below shows the length of two springs when an object was hung on each spring. Find the length of each spring that was stretched for every 10g of the objects.
B: 0.4cm
B: 0.5cm
B: 0.6cm
B: 0.7cm
Sorry. Please check the correct answer below.
Spring A: 0.9cm. Spring B: 0.6cm $\rightarrow$ A 220g $\rightarrow$ 20cm – 2cm = 18cm, divide by 20 = A 10g $\rightarrow$ 0.9cm, divided by 30 $\rightarrow$ B 300g $\rightarrow$ 20cm – 2cm = 10cm, B 10g $\rightarrow$ 0.6cm
B: 0.6cm
You are Right
Spring A: 0.9cm. Spring B: 0.6cm $\rightarrow$ A 220g $\rightarrow$ 20cm – 2cm = 18cm, divide by 20 = A 10g $\rightarrow$ 0.9cm, divided by 30 $\rightarrow$ B 300g $\rightarrow$ 20cm – 2cm = 10cm, B 10g $\rightarrow$ 0.6cm
The distance time graph shows the journey takes by Mr Lim from Town A to Town D. Which statement describe the graph?
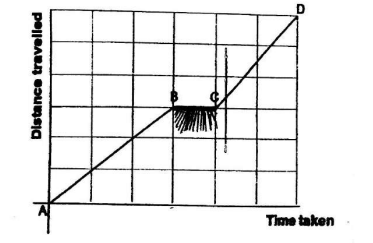
Sorry. Please check the correct answer below.
You are Right
There were 45 liters of water in a tank at 08:00. What flow out of the tank from 08:00 to 10:00 as shown in the line graph below. On the average, what is the rate of water that flowed out of the tank?
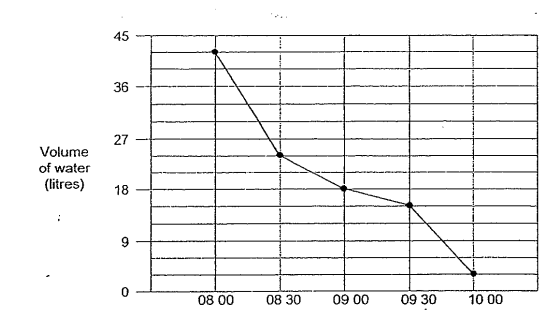
Sorry. Please check the correct answer below.
You are Right
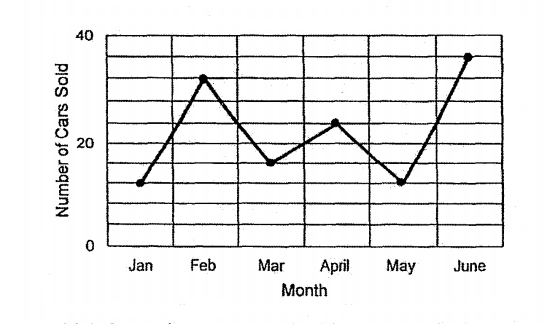
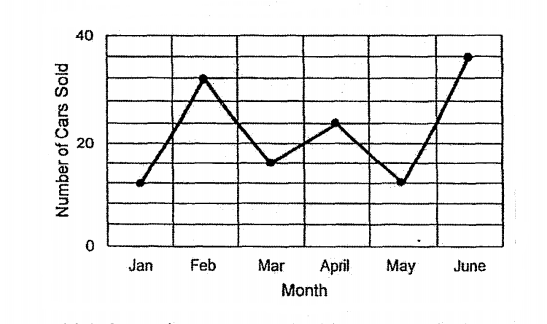
The line graph below shows the sale of cars in a showroom from January to June. Study the graph and answer the questions.
(a) Between which 2 months was there the biggest drop in the sale of cars?
(b) In which month, was the sale of cars 1$\frac{1}{2}$ times that of March?
(c) What was the average number of cars sold per month from January to June?
(b) February
(c) 20
(b) March
(c) 21
(b) April
(c) 22
(b) April
(c) 23
Sorry. Please check the correct answer below.
(a) February & March
(b) 20 ÷ 5 = 4
4 x 4 – 16
16 x 1$\frac{1}{2}$ = 24
The sale of cars was 1$\frac{1}{2}$ times that of March in April.
(c) 12 + 32 + 16 + 24 + 12 + 36 ÷ 6 = 22
(b) April
(c) 22
You are Right
(a) February & March
(b) 20 ÷ 5 = 4
4 x 4 – 16
16 x 1$\frac{1}{2}$ = 24
The sale of cars was 1$\frac{1}{2}$ times that of March in April.
(c) 12 + 32 + 16 + 24 + 12 + 36 ÷ 6 = 22
The line graph shows the amount of petrol used by Mrs Tan for the first 6 month of the year. Mrs Tan pais \$2.00(inclusive of GST( for each liter of petrol. What is the average amount of money spent?
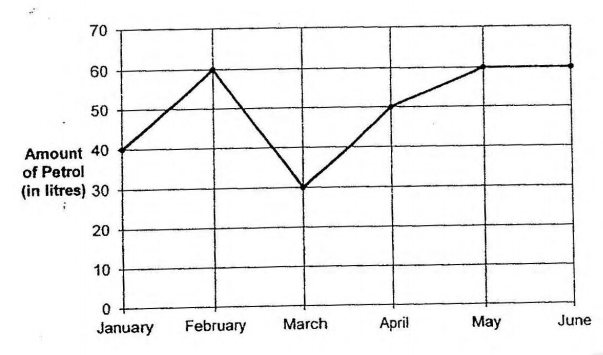
Sorry. Please check the correct answer below.
You are Right
The line graph below shows the number of fishes in a pond from 2005 to 2009. What was the percentage decrease in the number of finish from 2005 to 2009?
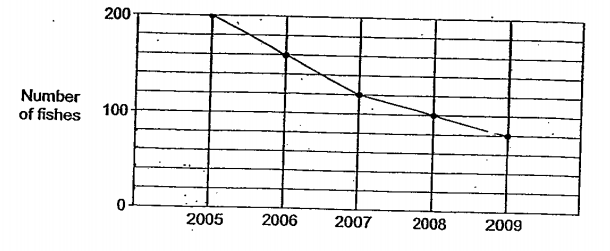
Sorry. Please check the correct answer below.
You are Right
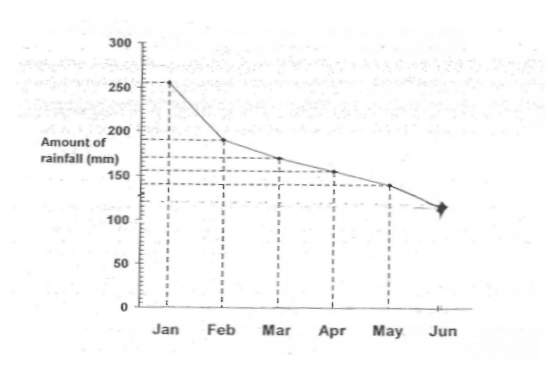
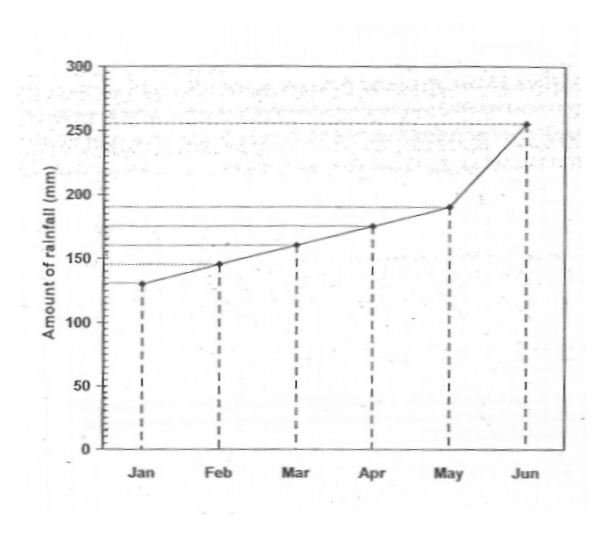
The line graph shown the amount of rainfall recorded from January to June.
How much more rainfall was collected in May than in February?
Sorry. Please check the correct answer below.
30.45mm $\rightarrow$ 50 ÷ 10 = 5, $8 \times 5 = 40$, 40 ÷ 150 = 190 (May), $1 \times 5 = 5$, 150 -5 = 145 (Feb), 190-145 = 45
You are Right
30.45mm $\rightarrow$ 50 ÷ 10 = 5, $8 \times 5 = 40$, 40 ÷ 150 = 190 (May), $1 \times 5 = 5$, 150 -5 = 145 (Feb), 190-145 = 45
The line graph below shown the monthly average rainfall received from January to June in Singapore.
(a) Between which two consecutive months was there the greatest increase in the average rainfall received Singapore?
(b) Based on your answer in (a), what is the percentage increase in the average rainfall received? Give your answer correct to 2 decimal places.

(b) 5.45%
(b) 5.47%
(b) 5.50%
(b) 5.53%
Sorry. Please check the correct answer below.
(a) February and March
(b) 5.45% $\rightarrow$ 174 – 165 =9, $\frac{9}{165} \times 100% = 5.45$%
(b) 5.45%
You are Right
(a) February and March
(b) 5.45% $\rightarrow$ 174 – 165 =9, $\frac{9}{165} \times 100% = 5.45$%
PSLE-Math.com
Start winning at math! Be part of Singapore PSLE Math community and Unleash the Your Maths Potential!
General
2026 © All Rights Reserved. Privacy Policy | Terms of Service
What subject area do you need help in?
Select level
Select subject